Cryptocurrency Circle Academician: Is Ethereum's Technical Structure Weakening Completely on 5.29? Latest Market Analysis and Trading Suggestions
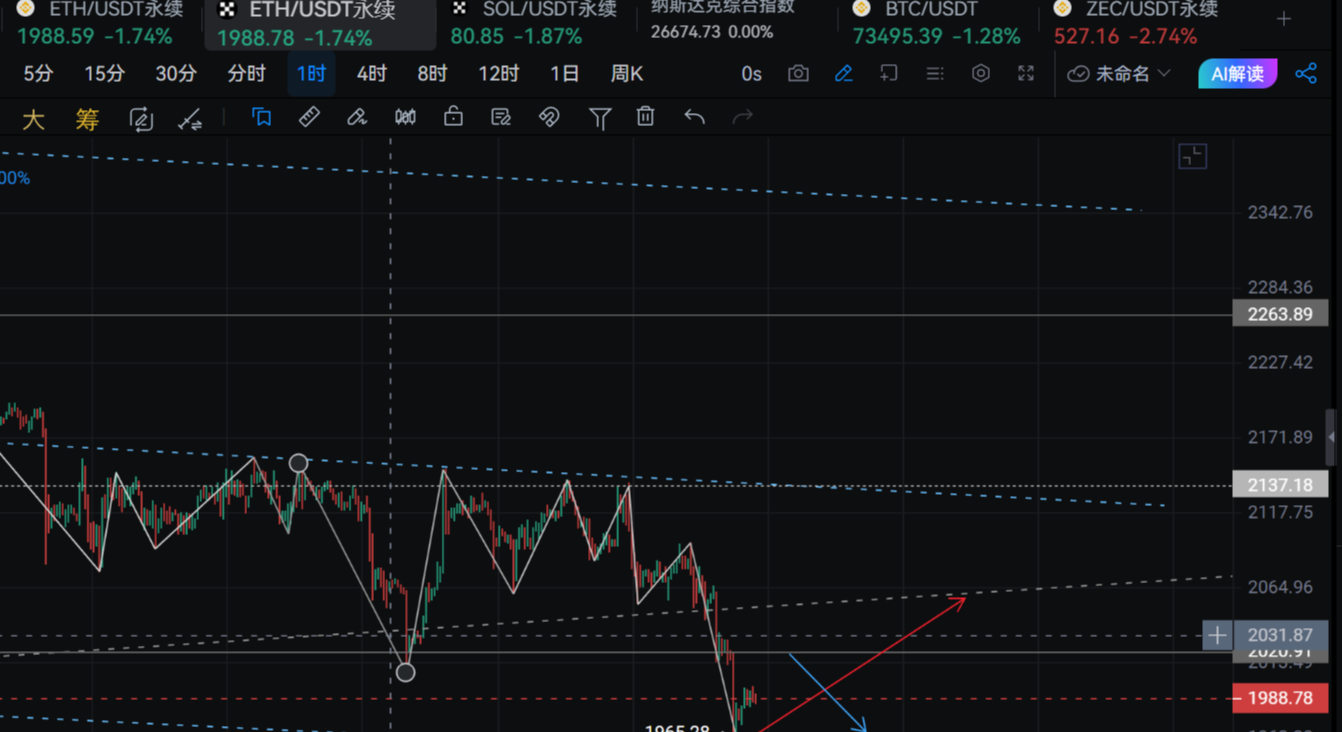
Ethereum's current price is 2015. To be honest, I have been quite emotional while looking at the K-line for the past few days. Watching the price hover around 2000, many fans have come to ask me whether to buy the dip or to hold positions. I know everyone is afraid of missing the market and also afraid of losing more. But to be honest, when the trend is downward, buying the dip really feels like touching a tiger's butt; going north should only be a short-term play. If you make a profit, just run! Don’t be greedy. I have also fallen into the trap of holding positions and know what it feels like to get more anxious the longer you hold. Really, don’t compete with the market; use small positions and manage stop losses well. Surviving is more important than anything else. Take it slow, let’s wait for a decisive opportunity together, no need to rush.
The daily K-line is in a weak oscillation pattern after a continuous downward trend. The price is suppressed by all moving averages such as EMA15 and EMA30, forming a standard downward arrangement, with increasing pressure from above. The MACD indicator is below the zero axis, and both DIF and DEA continue to diverge downward. The MACD histogram is negative, and there are no obvious signs of a decrease in downward momentum. The Bollinger Bands are opening downwards, with the price running along the lower track. The strong support is located at the previous low of 1736, while the first resistance is around the EMA30 moving average near 2174.
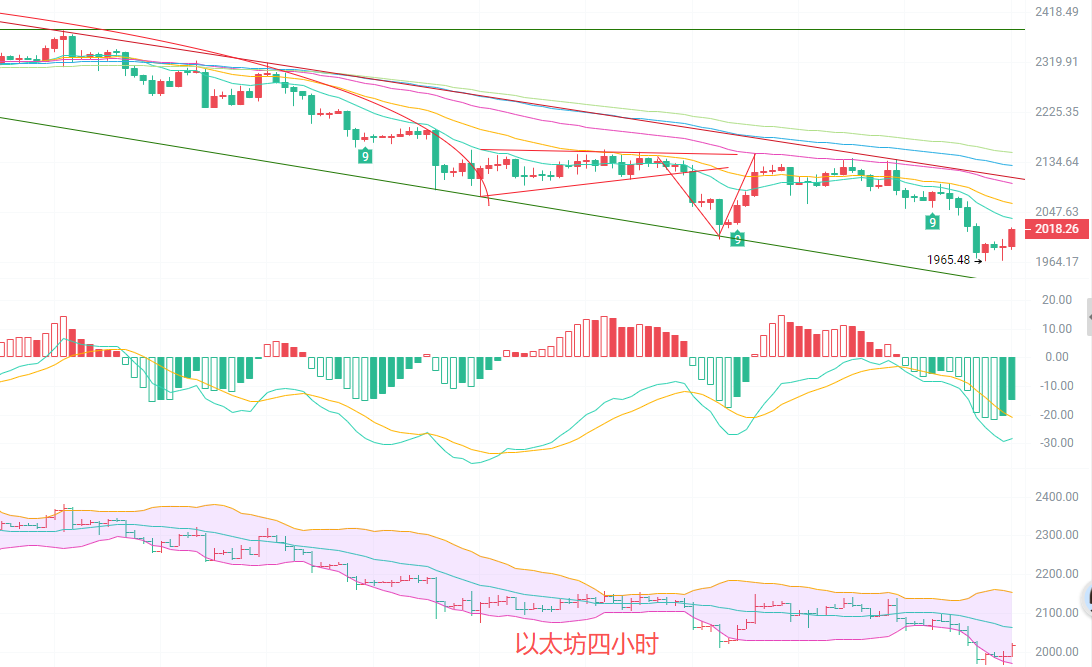
The four-hour K-line is in a clear descending channel, with highs continuously moving lower and lows also being refreshed. The downward trend line suppression is effective. The price is consistently running below the EMA15 and EMA30, and several rebounds have met resistance and fell back, showing no resistance to going north. The MACD indicator is running below the zero axis, and after the DIF and DEA crossed down, it continues to move downward, with sufficient downward momentum. The Bollinger Bands are opening downward, with the price running along the lower track. The lower track support is at 1970, while the upper track resistance is at 2154. The short-term rebound is merely a technical correction and does not change the downward trend.
Short-term Reference:
Downward from 2060 to 2080, stop loss at 2110, target looking at 1980 to 1950
Upward from 1960 to 1940, stop loss at 1910, target looking at 2020 to 2040
Specific operations should rely on real-time data from the market. For more detailed information, you can consult me. The article is published with a delay and is intended for reference only, and the risk is borne by yourself.


Friendly Reminder: The above content can only be found on the official account and Weibo created by the author. The ads at the end of the article and in the comments section are unrelated to the author. Please be cautious in distinguishing, thank you for reading.
免责声明:本文章仅代表作者个人观点,不代表本平台的立场和观点。本文章仅供信息分享,不构成对任何人的任何投资建议。用户与作者之间的任何争议,与本平台无关。如网页中刊载的文章或图片涉及侵权,请提供相关的权利证明和身份证明发送邮件到support@aicoin.com,本平台相关工作人员将会进行核查。