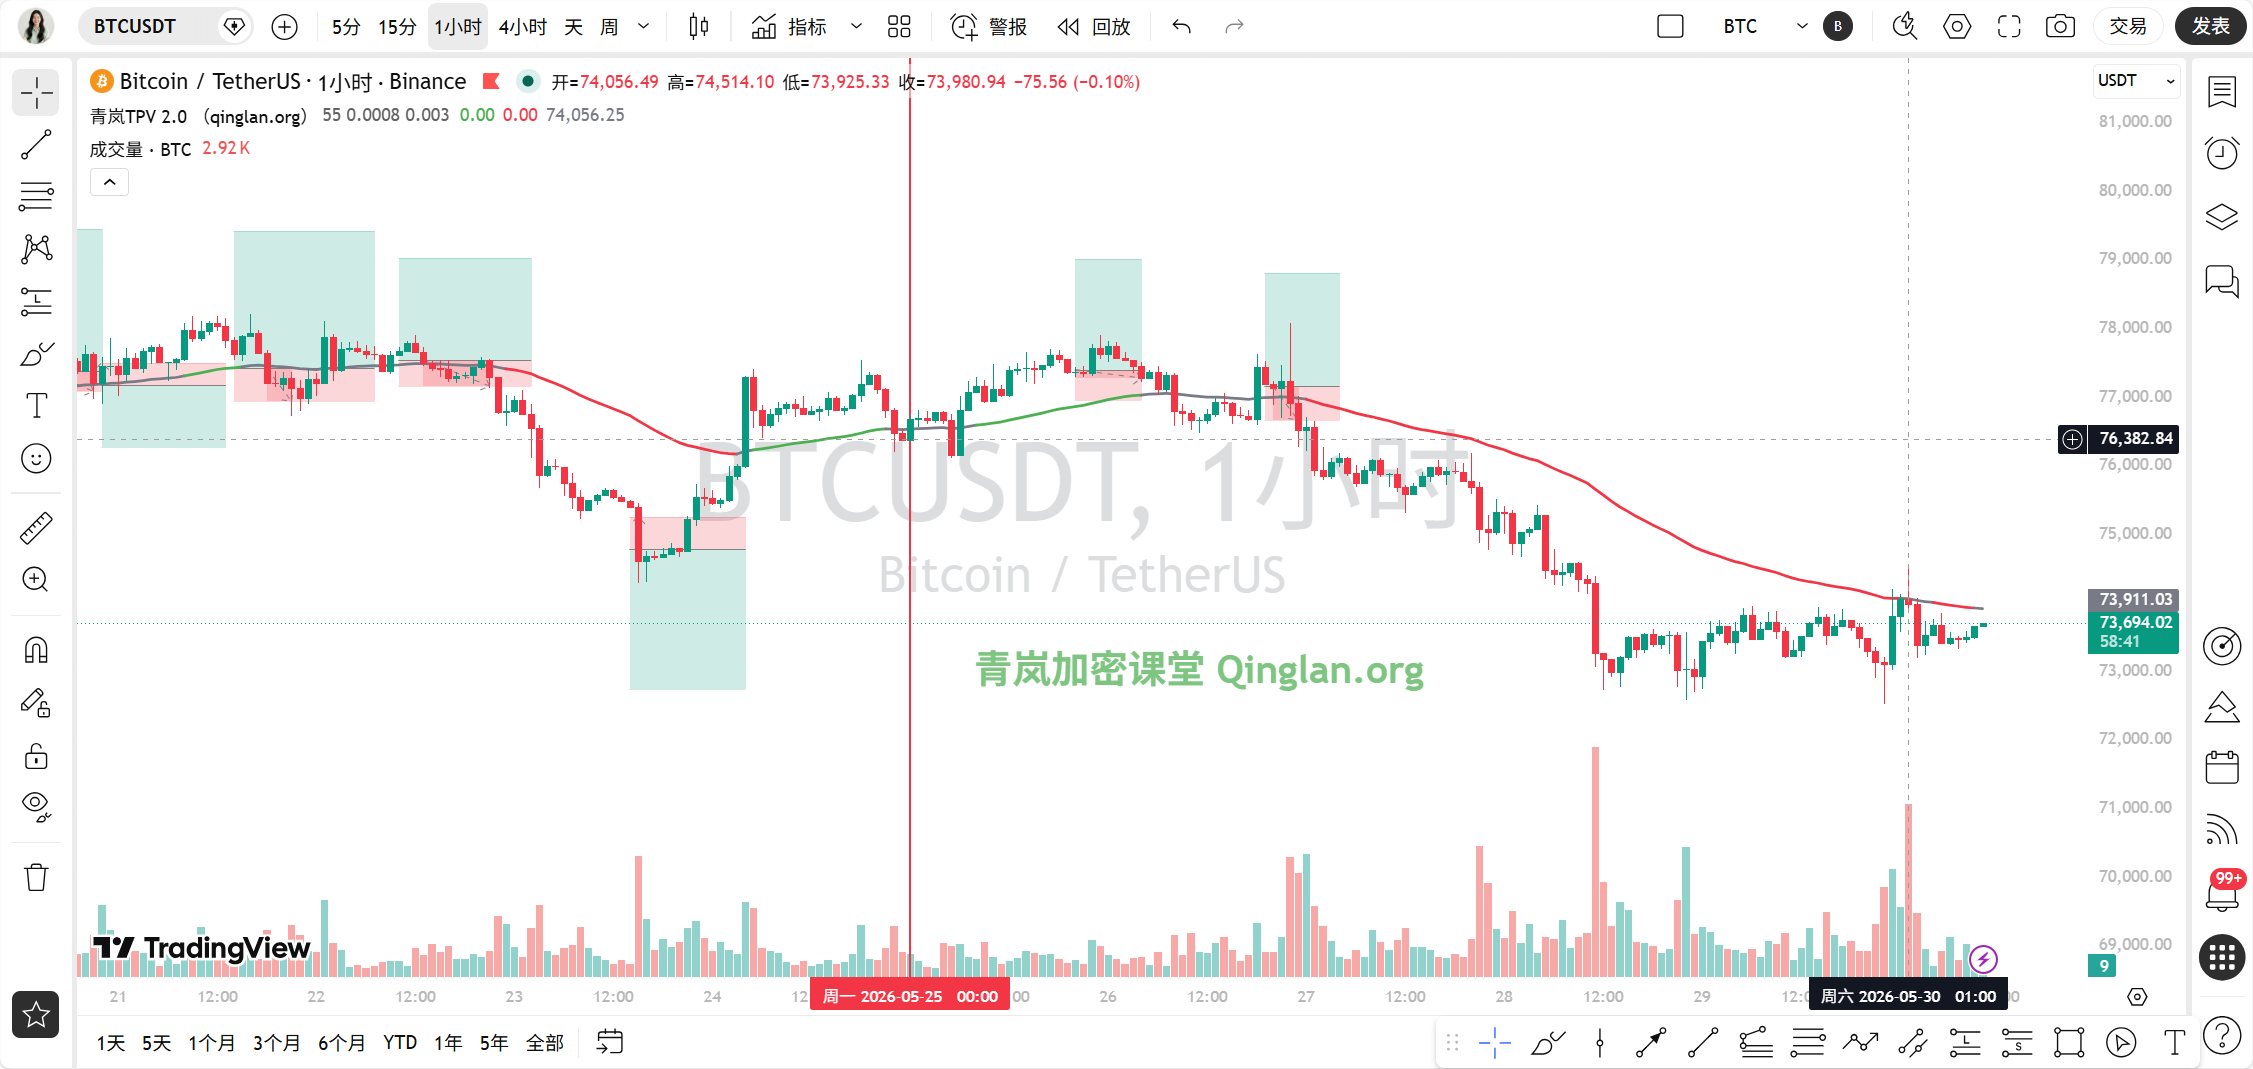
Dear friends, I am Sister Qinglan. Today, there are two significant news in the market worth noting: BlackRock's Bitcoin ETF size surpasses 54 billion US dollars, setting a historical record, and SpaceX disclosed holding about 18,700 Bitcoins at an average price of 35,000 US dollars. Continuous inflow of institutional funds and major enterprises increasing their holdings directly boosted market confidence, with Bitcoin strongly breaking through the key resistance level of 74,000 US dollars, achieving a daily increase of 1.57%. However, at the same time, the U.S. Treasury confirmed the seizure of about 1 billion US dollars in crypto assets from Iran, and increased regulatory enforcement may bring short-term concerns. This mixed situation of bulls and bears is exactly the analysis scenario that our Qinglan Crypto Classroom excels at.
Current Price and Time
The current time is May 30th, 09:59, with the latest BTC quote at 73,658 USDT, a 24-hour decline of 0.21%. The price showed a slight retreat after breaking through 74,000 but remains in a high-level fluctuation range. The fear and greed index is at 23, indicating extreme fear, suggesting that market sentiment is not overheated, but rather has potential rebound space.
Multi-Cycle Status Overview
Daily Level: MA5=74,223, MA10=75,540, MA30=78,165, the price is below all moving averages. The MACD bar is -585.05, DIF=-1,030.72, DEA=-445.67, with bearish momentum continuing to release but narrowing. RSI=27.58 is in the oversold area, which is a typical bottom divergence signal, suggesting that the daily level might brew a rebound.
4-Hour Level: MA5=73,587, MA10=73,473, MA30=75,116, the price is above MA5 and MA10 but is suppressed by MA30. The MACD bar is 56.53, DIF=-722.11, DEA=-778.64, with bearish momentum continuously narrowing, and DIF is about to cross DEA forming a golden cross. RSI=35.24 has rebounded from the oversold area, and bullish momentum is accumulating.
1-Hour Level: MA5=73,502, MA10=73,611, MA30=73,560, the price is oscillating between MA5 and MA10. The MACD bar is 13.00, DIF=-29.73, DEA=-42.73, with bearish momentum continuing to narrow but not yet turning positive. RSI=52.94 is in a neutral strong area. EMA55=73,859.83, the current price of 73,658 is below EMA55, but the distance is only 0.27%, belonging to line fluctuations.
15-Minute Level: MA5=73,592, MA10=73,533, MA30=73,541, the price is above the moving averages. The MACD bar is 25.80, DIF=-3.98, DEA=-29.78, with bullish momentum strengthening. RSI=61.35 is in the strong area, indicating short-term upward momentum.
TPV Signal Verification
According to the Qinglan TPV system, we take 1-hour EMA55=73,859.83 as the boundary line between bulls and bears. The current price of 73,658 is below EMA55, belonging to the bearish trend area. However, it should be noted that in the past eight 1-hour K-lines, the closing price greater than EMA55 occurred 0 times, crossing occurred 0 times, and the price distance from EMA55 is 0.27%, which is less than the 0.3% threshold. Although it does not meet the oscillation conditions, the line fluctuations increase the probability of oscillation, necessitating caution against false breakouts.
Shorting Conditions Verification: The price continuously closes below EMA55 for two consecutive 1-hour K-lines, condition 1 is met. However, the current shape has not shown long upper shadow lines or top formation, condition 2 is not met. The MACD bar has shortened for two consecutive cycles, and RSI has rebounded from 52.94, condition 3 is not met. Therefore, the short signal is not established.
Long Conditions Verification: The price has not stabilized above EMA55, condition 1 is not met. However, a long lower shadow line appeared at the 15-minute level, and RSI rebounded from 61.35, showing signs of support and stabilization in the short term. The MACD bars are continuously narrowing at both the 15-minute and 1-hour levels, indicating that the bearish momentum is waning. If the price can break through and stabilize above EMA55, the long conditions will gradually be established.
Handling Oscillation Market: The current price is fluctuating near the line, with a distance of only 0.27% from EMA55, belonging to a high probability oscillation range. The system suggests not actively going long or short but provides interval operation ideas.
On-chain Capital Situation
The fear and greed index is at 23, indicating extreme fear, and historical data shows that this level often corresponds to a stage bottom. BTC market share is at 57.55%, indicating that funds are still concentrating on Bitcoin. Institutional funds continue to flow in, BlackRock's ETF size hits a record, and SpaceX increases its holdings, all of which are long-term positives. However, the U.S. seizing Iranian crypto assets and the SEC suing scams may suppress speculative sentiment in the short term. In terms of capital flow, the U.S. money market fund size has reached a new high, but some funds may be diverted, with limited impact.
Key Offensive and Defensive Levels
Upper First Resistance: 74,000, which is a psychological level after the breakout, and also a previous high point. Second Resistance: 75,000, near the daily MA5, which may accelerate after the breakout. Third Resistance: 76,000, the 4-hour MA30 pressure point.
Lower First Support: 73,500, a dense area of 15-minute and 1-hour moving averages. Second Support: 73,000, near the 4-hour MA10. Third Support: 72,500, a key support at the daily level that if broken may test 72,000.
Trading Ideas
Direction: Oscillating with a bias toward bullish, waiting for breakthrough confirmation.
Entry Conditions: If the price breaks through and stabilizes above the 1-hour EMA55 (73,859.83), and two consecutive 1-hour K-lines close above this line, while the MACD bar turns positive, a light long position can be established. If the price retraces near 73,500 and shows a long lower shadow or bottom formation, consider going long.
Stop-loss Level: Set the stop-loss for long positions below 73,000; if broken, exit. For short positions, set the stop-loss above 74,000.
Target Level: First target 74,000, second target 75,000, third target 76,000. If the price breaks below 73,000, the target looks towards 72,500.
Risk Reminder
The current price fluctuates near the line, increasing the probability of oscillation; caution is needed for double stop-loss risks brought by false breakouts.
Follow Qinglan Crypto Classroom to seize more trading opportunities! Welcome to visit the official website www.qinglan.org
📊 Qinglan TPV Trading Strategy Backtest Reference
🕒 Last Backtest Time 05-30 07:00:01
Total Analysis: 1885 Backtest: 1622 Accuracy Rate: 67.3% (1092/1622)
免责声明:本文章仅代表作者个人观点,不代表本平台的立场和观点。本文章仅供信息分享,不构成对任何人的任何投资建议。用户与作者之间的任何争议,与本平台无关。如网页中刊载的文章或图片涉及侵权,请提供相关的权利证明和身份证明发送邮件到support@aicoin.com,本平台相关工作人员将会进行核查。