Many people who trade have experienced this: clearly seeing the right direction, but buying leads to a drop or selling leads to a rise; either being stopped out by a spike or missing an entire wave of market movement. It's not that you have bad luck, but that when you noticed the market, the big players had already completed their transactions. Today, I will use one hour to teach everyone how to understand the active funds in the market through the large transaction indicator, revealing who is actively eating orders, who is quickly entering the market, and who is forcefully pushing and smashing prices, making the actions of the big players impossible to hide.
First Understand: The Two Core Logics of Transactions
Before discussing the indicators, let's clarify the most basic logic of transactions. All transactions in the market essentially fall into two categories: limit orders and market orders, and the intentions behind these two types of orders are completely different.
1. Limit Orders: Passive Waiting, Providing Liquidity
A limit order is where you set a price and wait for others to fill it, similar to listing a second-hand house, waiting for someone to buy at your desired price. The advantage is that you can obtain the price you want, but the risk is that it may not get filled; if the price doesn’t drop to your order price and instead rebounds, you may miss out. Limit orders are passive actions and their main function is to provide liquidity to the market, but they have a fatal flaw: they can be canceled at any time. Many big players use large limit orders to create illusions, like placing a buy order of several tens of millions to support the price, making you think there is support; once you enter the market, they immediately cancel the order and sell off. Therefore, just looking at the limit orders can easily mislead you.
2. Market Orders: Actively Sweeping Orders, Real Cash Traces
A market order does not specify a price and demands immediate execution, like hailing a taxi without caring about the fare, just getting in and going. It actively consumes the limit orders displayed on the order book with the sole purpose of achieving quick execution. The cost is that it generates slippage; if there isn’t enough volume on the order book, it will automatically eat into the sell orders at levels two and three or drop into the buy orders at levels two and three, causing a discrepancy between the actual execution price and the expected price. For example, we observed a major sell order of 8.11 million USD that incurred a slippage of 249 USD, meaning that to sell quickly, the player was willing to accept a lower price, earning 249 USD less per unit. What does this indicate? It shows that their intention is very urgent, and they do not care about this slippage cost. This is where the value of market orders lies: they are real cash transactions that cannot be rescinded once completed, leaving the most authentic footprints of the big players. 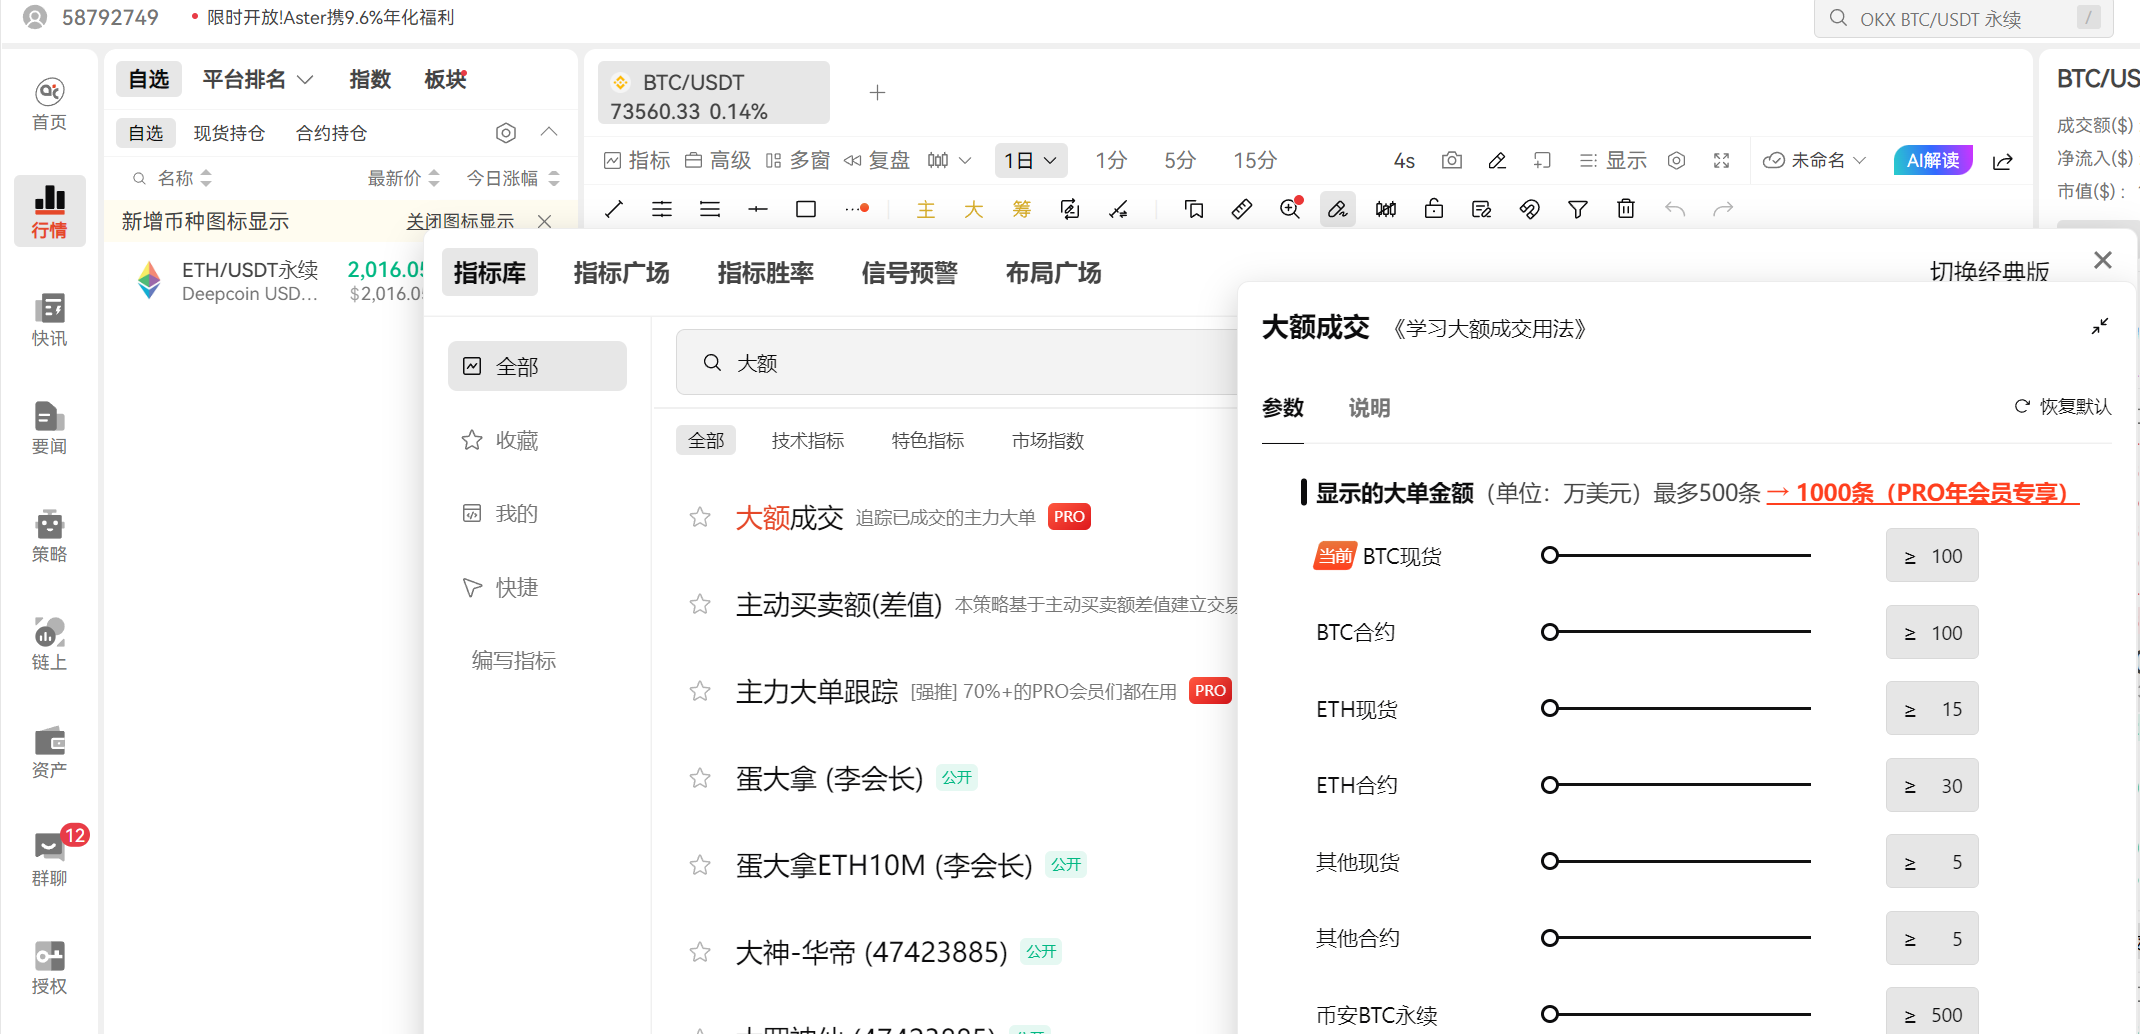
Large Transaction Indicator: Visualizing Big Players' Actions
Our large transaction indicator filters all market market orders based on a set funding threshold, marking the truly significant orders belonging to big players and large funds on the K-line chart, allowing you to see at a glance what the big players are doing.
- Green Circles: Big players' market buy orders, indicating active buying
- Red Circles: Big players' market sell orders, indicating active selling
- Circle Size: Represents the transaction amount; the larger the circle, the higher the amount
1. How to Set Up the Indicator?
It's very easy to operate, usable on the web version, desktop, and mobile:
- Open AiCoin, click on the "Indicator" in the upper left corner
- Search for "Large Transaction" in the indicator library
- Check this indicator, and it will automatically display on the main chart
If you only want to see large orders and filter out smaller orders of a few million, you can click on the indicator settings, drag the slider, or directly input a number to adjust the displayed amount threshold. For example, if you want to see ETH orders greater than 1 million, change the number to 100, and the system will automatically filter out all transactions below 1 million.
2. How to Examine the Details of a Large Order?
Hover your mouse over any circle, and you will see all the core information about that large order:
- Transaction Amount: The total scale of this order; the larger the amount, the stronger the signal
- Execution Price: The average price at which the big player actually executed
- Most Frequently Executed Price: The price range where this order consumed the most, which represents the main cost area for the big player
- Slippage: The deviation between the actual execution price and the order price; the greater the slippage, the more urgent the big player is
- Number of Transactions: How many counter orders this large order consumed
- Counter Order Type: Will indicate "Retail Orders" or "Institution Orders," informing you whether the big player is eating retail orders or other big players
How to Interpret Contracts? Combine with Position Difference for Accuracy
Many friends ask: it's easy to understand the green buy and red sell in spot trading, but is it the same for contracts? Here I want to remind everyone: You cannot judge contracts solely by the color of large transactions; you must consider the position difference indicator together.
1. First Understand Position Difference
The position difference is a secondary chart indicator that you can similarly find in the indicator library; it reflects the changes in position volume in the contract market:
- Green Bars (Above 0 Axis): Position volume increases, indicating that some big players are building positions (either going long or short)
- Red Bars (Below 0 Axis): Position volume decreases, indicating that some big players are closing positions or stopping losses
The contract market is a counter-trading market; if there are long positions, there are also short positions. Therefore, an increase in position volume indicates new funds entering the market for speculation; a decrease in position volume indicates funds exiting the market.
2. Four Core Formulas for Combined Judgment
By combining large transactions and position differences, you can accurately determine the big players' intentions:
- Green Buy Orders + Green Position Bars = Big Players Going Long: Big players are actively buying, while position volume increases, indicating they are building long positions, a bullish signal
- Red Sell Orders + Green Position Bars = Big Players Going Short: Big players are actively selling, while position volume increases, indicating they are building short positions, a bearish signal
- Red Sell Orders + Red Position Bars = Big Players Closing Longs: Big players are actively selling to close positions, while position volume decreases, indicating bulls are taking profits and exiting
- Green Buy Orders + Red Position Bars = Big Players Closing Shorts: Big players are actively buying to close positions, while position volume decreases, indicating bears are stopping losses and exiting
For example: we see a red sell order exceeding 6 million with a corresponding position difference of -24 (red bar), indicating that this is not a big player going short, but rather earlier bulls closing positions for profits, so one should not blindly chase shorts.
Practical Use: Two Signals to Capture Big Player Movements
Learning to look at the indicators is just the foundation; knowing how to use them to guide trading is key. Here are two of the most practical methods with high accuracy.
1. Single Large Orders: Turning Points
A single transaction that far exceeds the average level often signals a turning point in the market. Especially for super large orders on major platforms like Bitget and Binance, these are typically institutional behaviors and have the highest reference value.
- For BTC, focus on single orders exceeding 10 million USD
- For ETH, focus on single orders exceeding 5 million USD
For example, yesterday's drop was due to the appearance of an over 200 million USD super large short order, with a significant increase in position volume, indicating that the big player was heavily going short, which is a very clear bearish signal. If you had seen this signal at the time, you wouldn’t have blindly attempted to catch the bottom.
2. Dense Transaction Areas: Continuation Signals of Trends
If a series of circles of the same color continually appears within the same price range, forming a dense transaction area, this indicates that the big player is continuously operating, signaling a trend.
- Green Dense Transactions: Big players are actively sweeping up, likely leading to a rise
- Red Dense Transactions: Big players are actively unloading, likely leading to a decline
The most typical case was the previous HYPE; since last week, during every upward movement, there have been continuous green buy orders from big players, with dense transaction areas constantly moving up, indicating that the big players were actively accumulating. This is why its movement has been so firm; even when the market fell, its drop was small and it quickly rebounded. Conversely, when red dense transactions occurred at high levels, such as ETH on May 26 during a volatile range where the big player continuously sold in large amounts, net selling far exceeded net buying, this was a clear unloading signal, and entering the market here would result in being trapped.
Here’s a tip: if you can't visually distinguish which direction has a larger amount, you can use the large transaction statistics feature to select the range you want to analyze, and the system will automatically calculate total buys, total sells, and net transactions for that range, clearly showing the comparison of buying and selling forces.
Frequently Asked Questions
-
What if the big player splits into smaller orders? If a big player splits a 100 million order into 100 orders of 1 million each, it may fall below our filtering threshold, but this time, you can refer to the position difference. If the position volume increases significantly, it indicates that large funds are indeed entering the market. You can also examine the full depth indicator, which allows you to see the total number of all orders in a price range; even if the big player splits their orders, they will leave traces on the depth chart.
-
How to set exit signals? For entering, look at transactions; for exiting, look at limit orders. You can combine the big players' large order tracking indicators to see where they have placed large limit orders, especially those that have been around for a long time without being canceled; that position represents the big player's target or stop-loss point, which you can use as your exit point.
-
Which cryptocurrencies is this indicator suitable for? It is most suitable for mainstream coins (BTC, ETH, SOL, etc.) and recently popular coins (for example, the previous HYPE and LIVE), because these cryptocurrencies have good liquidity and substantial big player funds, making large transaction signals more apparent. For those low-volume obscure coins, a few tens of thousands can easily manipulate the market, and the indicator's reference value is not significant.
That's all for today's content. Finally, let me summarize: The large transaction indicator tracks the market orders of the big players; in spot trading, green buys and red sells are straightforward—contracts must be judged in conjunction with the position difference. A single large order signals a turning point, while a dense transaction area indicates a continuation of the trend. With this indicator, you'll see the actions of big players that ordinary K-lines do not reveal, and you will no longer be easily cut down like leeks.
免责声明:本文章仅代表作者个人观点,不代表本平台的立场和观点。本文章仅供信息分享,不构成对任何人的任何投资建议。用户与作者之间的任何争议,与本平台无关。如网页中刊载的文章或图片涉及侵权,请提供相关的权利证明和身份证明发送邮件到support@aicoin.com,本平台相关工作人员将会进行核查。