Cryptocurrency Scholar: Ethereum ETH on June 1st is deeply trapped in a weak situation, with dual line cycles synchronously weakening? Latest market analysis and operational suggestions
Many cryptocurrency friends are currently stuck in losses with Ethereum! Holding onto positions, they are restless, worried about breaking support one moment and scared of missing a rebound the next. I have advised this countless times, but it falls on deaf ears; no matter how much I say, it's of no use. These two concrete charts speak for themselves, showing the daily and 4-hour lines clearly. EMA, MACD, Bollinger Bands are all dissected for you, with long and short points, stop-losses, and take-profits clearly marked—easy enough for beginners to understand at a glance. No exaggeration, no criticism, just speaking about the most authentic current market situation, helping you clarify your thoughts, so you are no longer led by the market's emotions. Whether you are holding a losing position, sitting on the sidelines, or looking to increase your position, you'll have a clear picture after reading this!
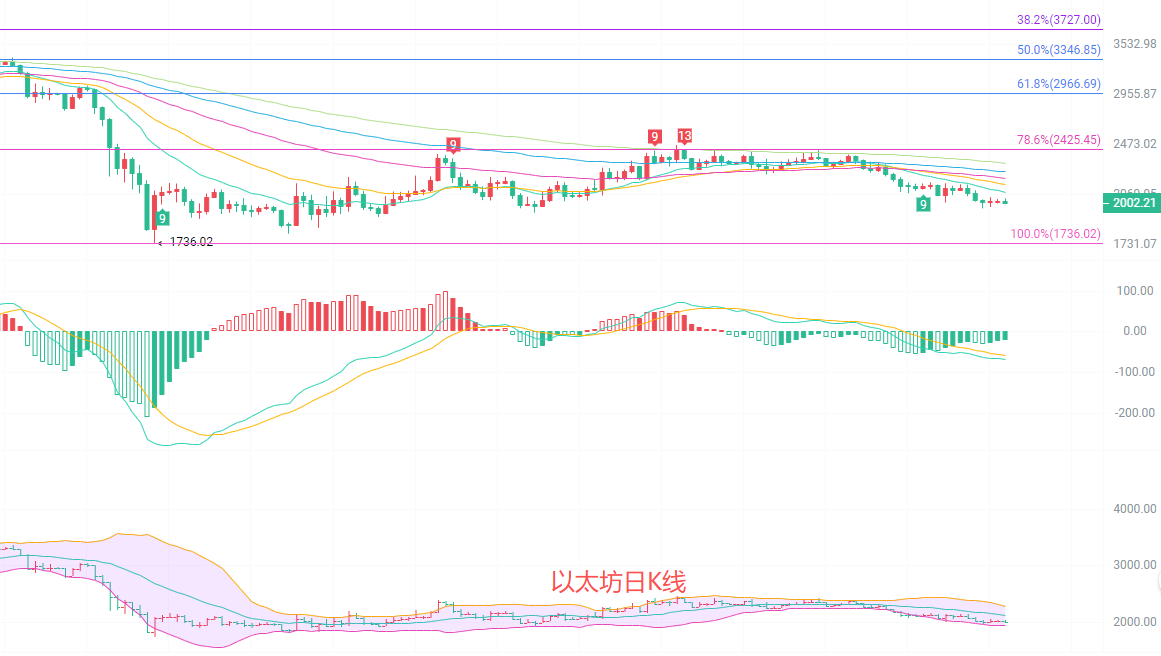
Ethereum's current price is 2002, and the daily K-line is currently in an obvious weak oscillation trend after a decline. The price has already fallen below EMA30, EMA60, and other short-term moving averages, with all moving averages aligned downward, facing considerable resistance above. In the MACD indicator, both DIF and DEA are below the zero axis, with green bars continuing. Although the downward momentum has weakened, it remains dominant. The Bollinger Bands are opening downward, with the price close to the lower band, and strong resistance forming near the middle band around 2119. The daily K-line closed in the red yesterday, with an amplitude of 2.08%. The short-term lacks strong rebound momentum, and the overall trend remains bearish, requiring vigilance against the risk of another decline.
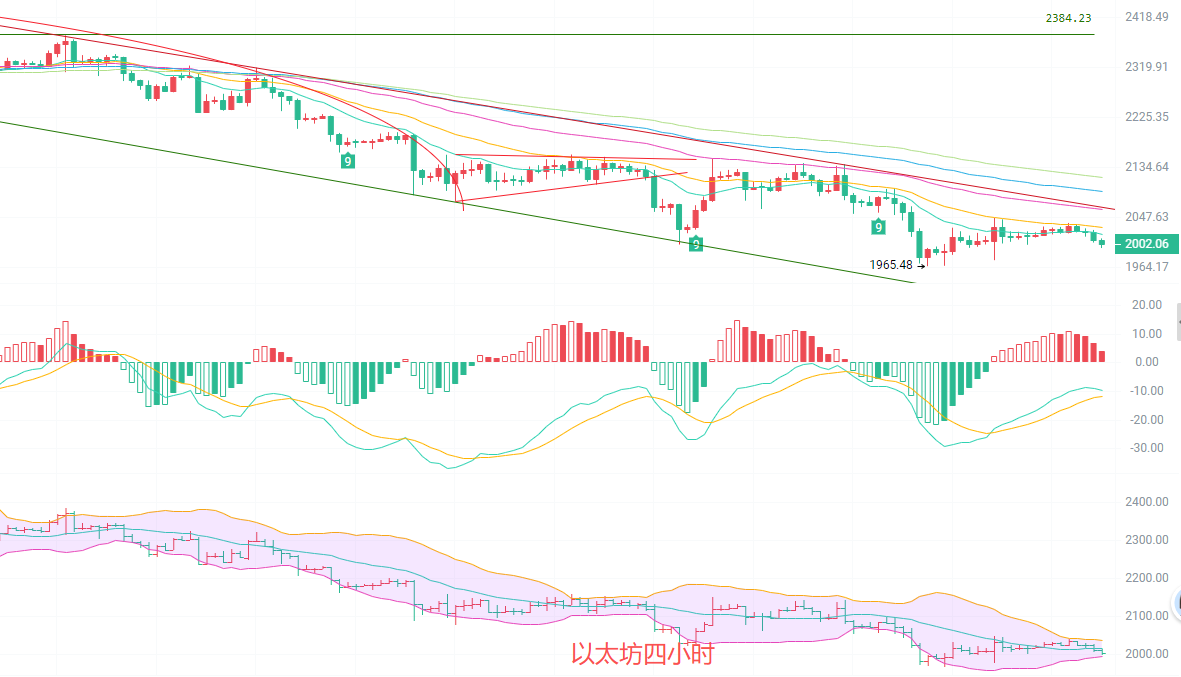
The 4-hour K-line is currently in a weak consolidation phase after a decline, with the price repeatedly testing support around the 2000 level. In the short term, the EMA15 and EMA30 moving averages are both trending downward, with prices under pressure below the moving averages, showing little power for rebound. The MACD indicator shows DIF and DEA below the zero axis, and after crossing upwards, the red bars are slightly expanding, but the momentum is insufficient, indicating a weak rebound signal during the decline. The overall Bollinger Bands are downward, with the price operating below the middle band; the upper band around 2036 presents strong short-term resistance, while the lower band around 1994 provides support. The volume does not support the movement, limiting space for rebound, and the downward trend has not yet reversed, with rebounds more likely to be false signals.
Short-term reference:
Sell from 2070 to 2100, stop-loss at 2120, target looking at 2040 to 2010
Buy from 1990 to 1960, stop-loss at 1930, target looking at 2030 to 2070
Specific operations should be based on real-time market data; for more detailed information, you can consult the author. The article is published with a delay, and the suggestions are for reference only; risks are self-assumed.


Kind reminder: The above content is created solely by the author on Weibo and the public account. The advertisements at the end of the article and in the comments section have no connection to the author; please distinguish carefully. Thank you for reading.
免责声明:本文章仅代表作者个人观点,不代表本平台的立场和观点。本文章仅供信息分享,不构成对任何人的任何投资建议。用户与作者之间的任何争议,与本平台无关。如网页中刊载的文章或图片涉及侵权,请提供相关的权利证明和身份证明发送邮件到support@aicoin.com,本平台相关工作人员将会进行核查。