This morning, Bitcoin plummeted to $63,000, with a 24-hour drop exceeding 5.6%. At the same time, there was a liquidation of $1.1 billion across the entire network, with long positions losing over $890 million. These two pieces of news directly indicate the current market's panic sentiment and the effects of capital flight. As an analyst from the Qinglan Crypto Classroom, I must remind everyone that this level of liquidation often signifies that the short-term selling pressure is nearing its end, but a reversal of the trend still needs confirmation. Today, we will analyze the current market using the Qinglan TPV system based on data.
Current Price and Time
The current time is June 4th, 10:16 AM, and the BTC price is 62,403 USDT. The price has broken through several key supports, and the market is in a state of extreme fear, with a Fear and Greed Index of just 11.
Multi-Period Status Overview
First, let's look at the daily chart: MA5=67,675, MA10=70,971, MA30=76,243, with the price far below all moving averages. The MACD histogram shows -1,440, and the RSI=11.23, which indicates a severely oversold area. The bearish trend on the daily chart is clear, but an RSI below 15 usually means the probability of a short-term rebound is increasing.
On the 4-hour level, MA5=65,027, MA10=65,958, MA30=70,505, MACD histogram -502, RSI=11.54. The 4-hour chart is also in an oversold state, but the MACD histogram is still expanding, indicating that the downward momentum has not yet exhausted.
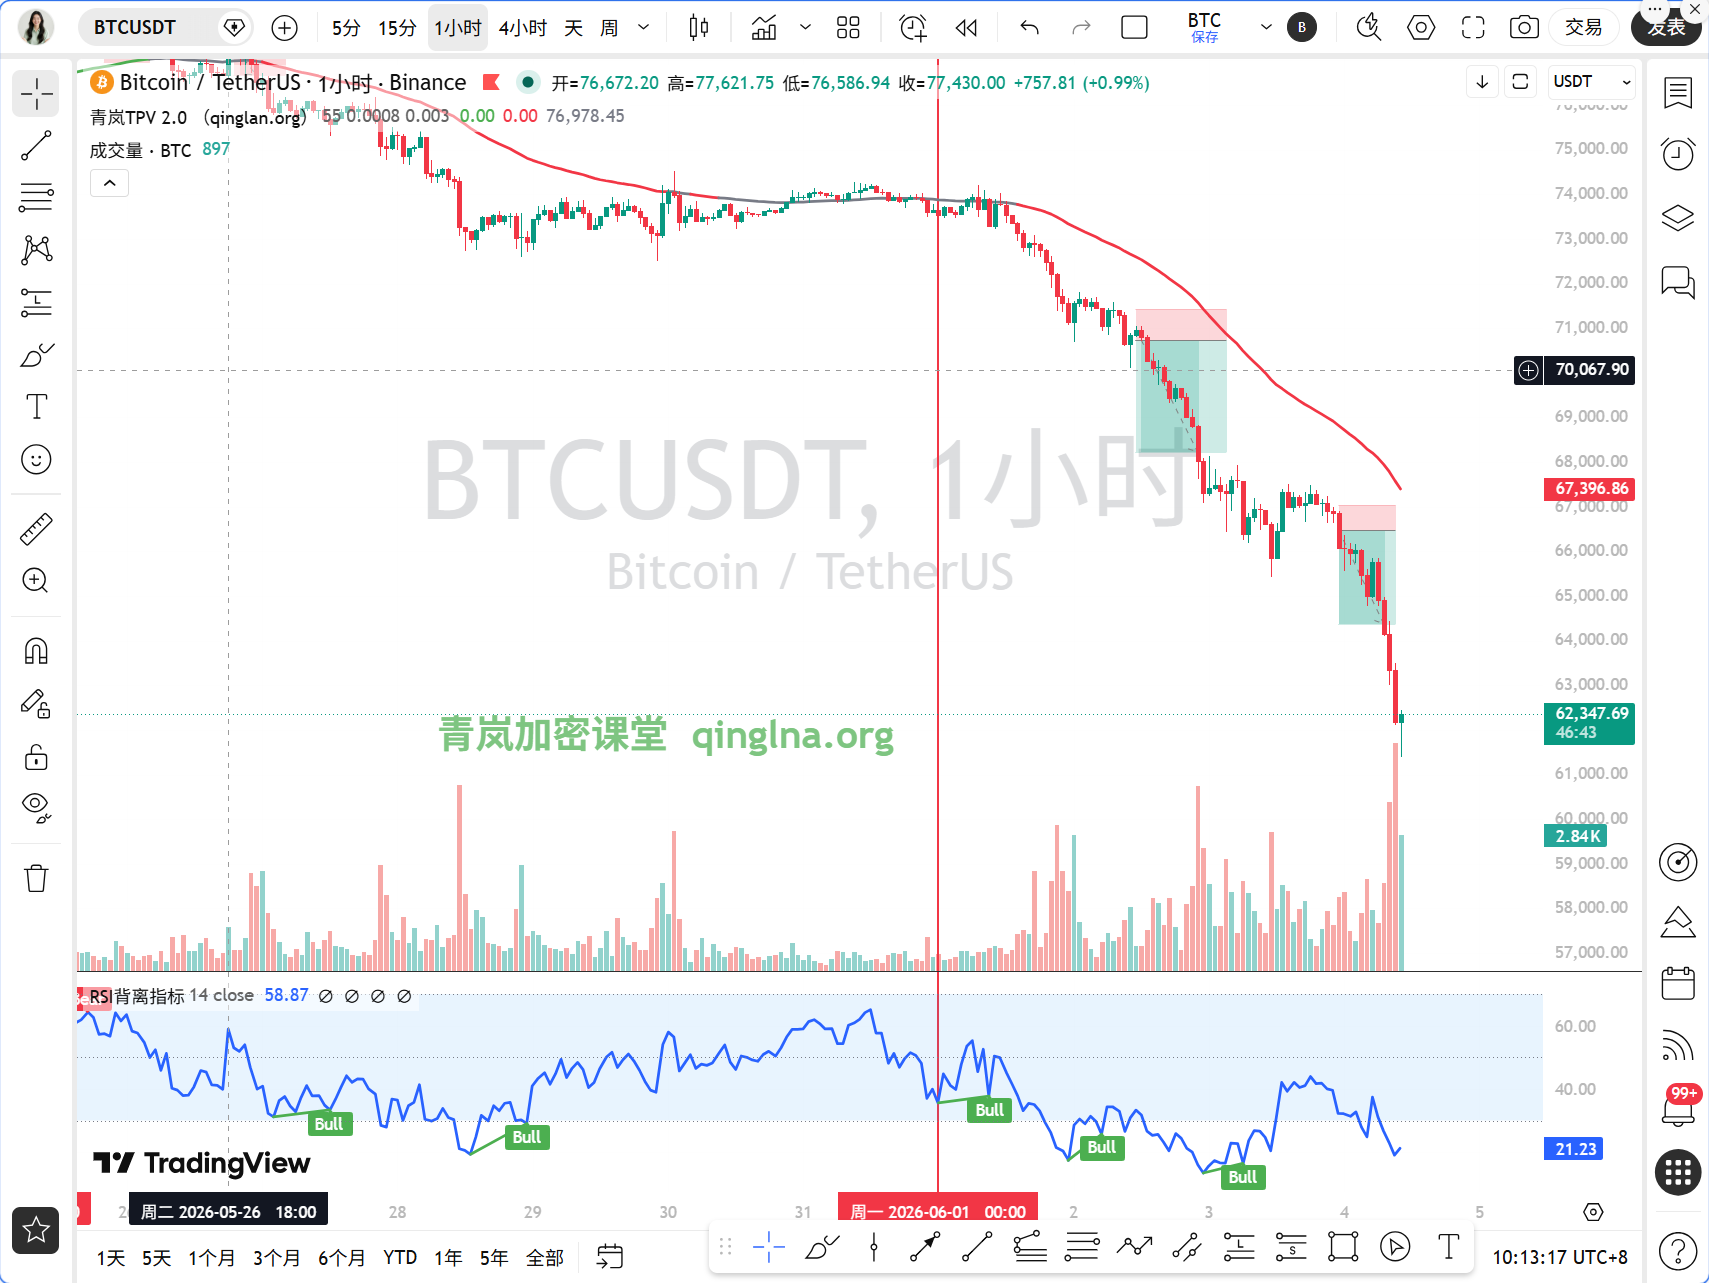
On the 1-hour level, MA5=63,396, MA10=64,522, MA30=66,057, EMA55=67,382. The current price at 62,403 is far below the EMA55, with a MACD histogram of -327 and an RSI of 15.59. The bearish trend on the 1-hour chart is very strong, but the RSI has also entered the oversold zone.
On the 15-minute level, MA5=62,501, MA10=63,024, MA30=64,487, MACD histogram -138, RSI=18.87. The 15-minute chart is also oversold, but the MACD histogram is starting to shorten, suggesting a potential small-level rebound in the short term.
TPV Signal Verification
According to the Qinglan TPV system, we first look at the trend positioning. The current price of 62,403 is far below the 1-hour EMA55 of 67,382, indicating that the market is in a bearish trend area. The oscillation auxiliary data also shows that in the last 8 1-hour candles, there have been 0 closing prices above EMA55 and 0 crossover occurrences, with a price fluctuation from EMA55 of 7.39%, not meeting the oscillation threshold, which belongs to a one-sided bearish trend.
Regarding short-selling conditions, first, the price is under pressure below the 1-hour EMA55, with 2 consecutive 1-hour candles closing below EMA55, which fully meets this condition. Second, resistance is encountered. From the 4-hour and 1-hour candles, the price has a significant long upper shadow around 65,000, forming a top diverging structure, meeting the condition. Third, the rebound lacks strength; the MACD histogram has been shortening for 2 periods, but note that the current 1-hour MACD histogram is still expanding, so the third condition is currently not met. This indicates that the bearish momentum is still being released, but no exhaustion signal has yet appeared.
Regarding long conditions, first, the price must stabilize above the 1-hour EMA55, which is completely not satisfied. Second, support should stabilize; currently, the price has short-term support around 62,000, but no bottom diverging structure or long lower shadow has formed yet. Third, bearish momentum must exhaust; the MACD histogram is still expanding, and although the RSI is oversold, it has not rebounded. Therefore, none of the long conditions are met.
In summary, the current system signal indicates a continuation of the bearish trend, but the exhaustion signal in the short-selling conditions has not appeared, so it is not advisable to follow the short positions but rather wait for a rebound and seek opportunities to short.
On-chain/Funding Aspect
On-chain data shows a Fear and Greed Index of 11, categorized as extreme fear. Historically, this position often corresponds to a stage bottom region, but do not blindly buy the dip. BTC's 24-hour drop is -3.92%, with a market share of 55.27%, indicating that funds are flowing out of BTC, but altcoins have seen even greater declines. In focus news, Abraxas Capital sold 2,469 BTC in one day, cashing out $166 million, which is a clear signal of bearish sentiment from institutions. Mt. Gox transferred 116.3 BTC to exchanges, possibly preparing to sell, increasing potential selling pressure. Federal Reserve officials warned that interest rates could rise this year, suppressing risk assets. These combined negative factors make a rapid short-term reversal difficult.
Key Attack and Defense Levels
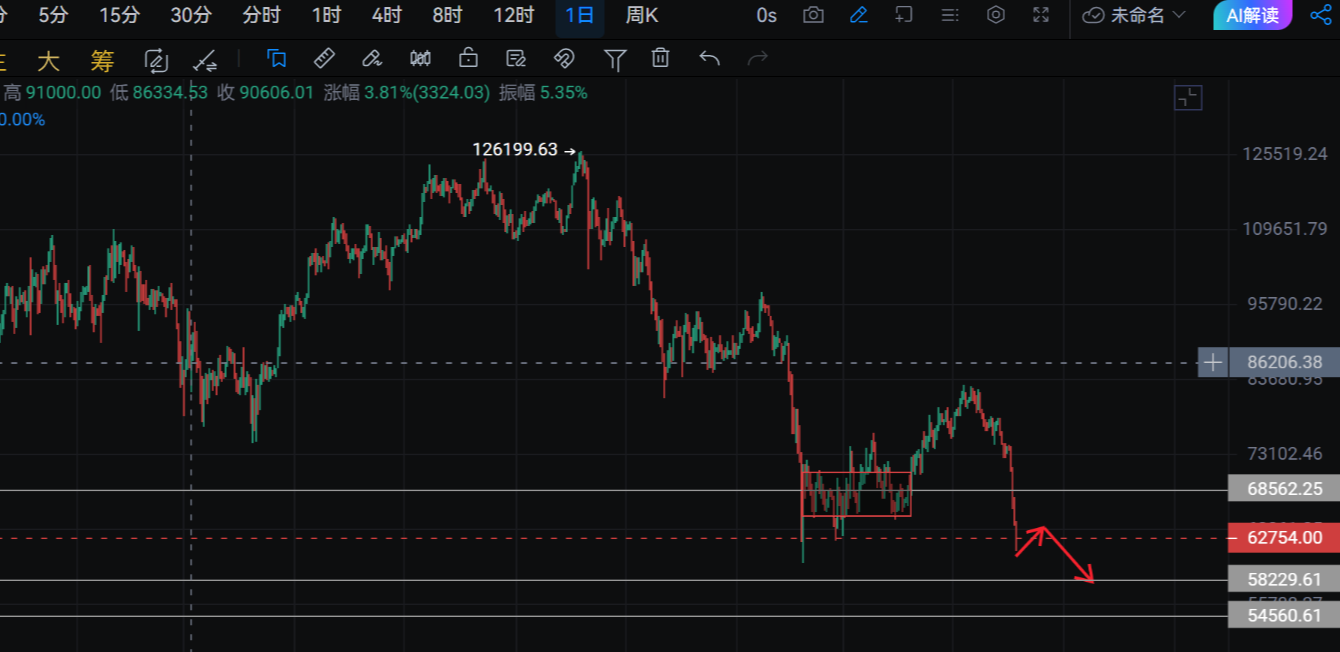
The first resistance level above is at the 1-hour EMA55 of 67,382, which is the boundary line between long and short, as well as a strong resistance to rebounds. The second resistance level is at the 4-hour MA5 of 65,027, which is a short-term rebound target. The first support level below is at the psychological level of 62,000. The second support level is at 60,000; if it breaks down, it may accelerate the decline to 58,000.
Trading Ideas
Direction: Bearish trend, but wait for a rebound to short, do not chase shorts.
Entry Conditions: If the price rebounds to the 65,000-65,500 area and a long upper shadow or top diverging structure appears on the 1-hour candles, simultaneously with the MACD histogram starting to shorten, a short entry can be made. If the price directly drops below 62,000, it is not recommended to chase shorts, as the severe oversold condition may lead to a rebound at any time.
Stop Loss: After entering the short position, set the stop loss above 66,000, i.e., above the 4-hour MA5.
Target: First target at 62,000, second target at 60,000, third target at 58,000. If a bottom diverging structure or long lower shadow appears around 62,000, partial profit-taking can be considered.
Risk Warning
The current market is highly volatile, with $1.1 billion liquidated in 24 hours; any trade must strictly control position size, and it is recommended that individual trade risk does not exceed 2% of total capital.
Follow Qinglan Crypto Classroom to grasp more trading opportunities! Welcome to visit the official website www.qinglan.org
📊 Qinglan TPV Trading Strategy Backtest Reference
🕒 Last Backtest Time 06-04 07:00:01
Total Analysis: 2005 Backtests: 1639 Accuracy: 67.7% (1109/1639)
免责声明:本文章仅代表作者个人观点,不代表本平台的立场和观点。本文章仅供信息分享,不构成对任何人的任何投资建议。用户与作者之间的任何争议,与本平台无关。如网页中刊载的文章或图片涉及侵权,请提供相关的权利证明和身份证明发送邮件到support@aicoin.com,本平台相关工作人员将会进行核查。