BTC today dropped to a low of $61,500, with $1.2 billion liquidated; our signal increased by 68% in 8 hours
June 4, 2026 | AlphaQuant Quantitative Research
First, let’s talk about something that just happened
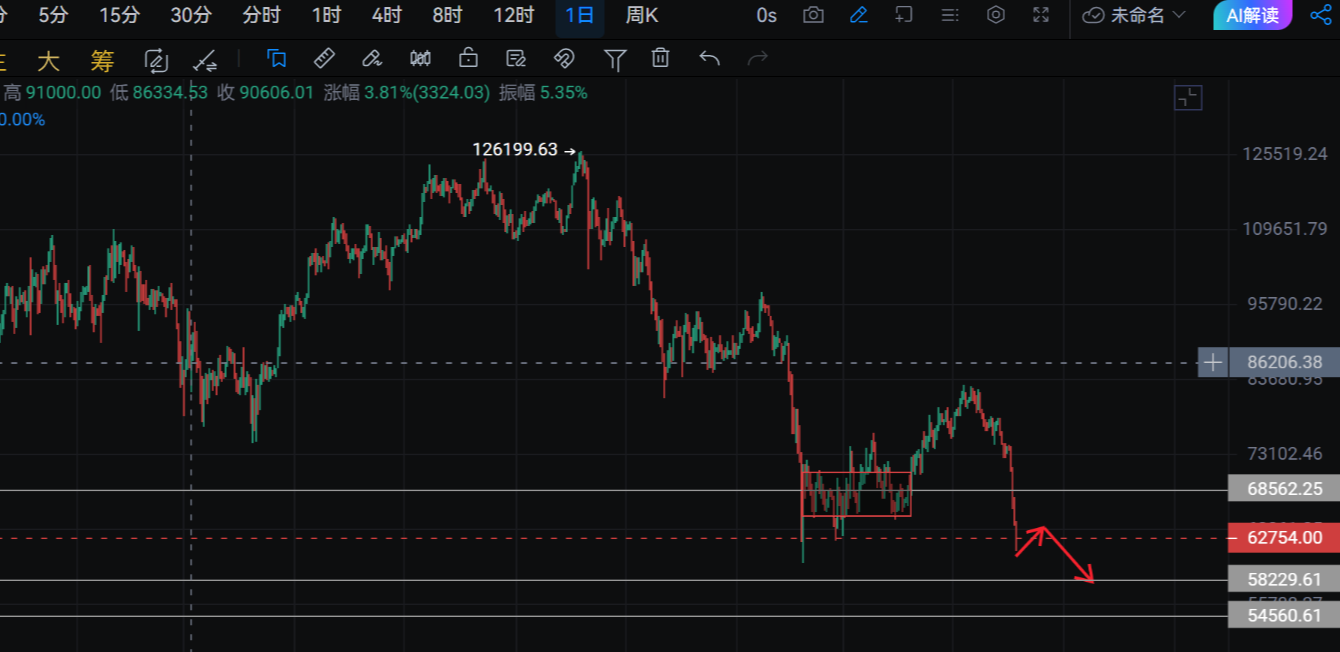
Today, Bitcoin hit a low of $61,500, with a current price of $62,188.
The market is in despair, with $1.23 billion in long positions forcibly liquidated.
Yet amid this panic, our community issued a signal—OPN/USDT.
Warning price: $0.1433 Current price: $0.2419 8-hour increase: +68.8%
BTC dropped today, but our signal rose by 68%.
It’s not luck; it’s the system.
Today’s BTC: $62,188, what happened?
BTC today reached a low of $61,500, with a current price of $62,188, down over 50% from the historical high of $126,000 in October 2025; this is the most severe day of this downturn.
But this day of crashing was not accidental.
Six heavyweights pressing down simultaneously
Cryptocurrency analyst Lark Davis pointed out that this BTC drop was caused by six factors simultaneously exerting pressure: continuous net outflows from ETFs, Strategy selling BTC, Mt. Gox distributions, funds being diverted to AI stocks, technical breakdown, and four-year cycle patterns.
Let’s break them down one by one:
Heavyweight One: Strategy sells BTC for the first time in three years
Michael Saylor's Strategy (formerly MicroStrategy) sold 32 BTC last week, totaling about $2.47 million; this is the company's first sale of Bitcoin since 2022.
In terms of amount, 32 BTC has almost no impact on the market.
However, in terms of signaling, this event shook the entire market—an institution known for “never selling BTC” has started to sell.
Retail traders immediately took this as a panic trigger.
Heavyweight Two: $1.23 billion liquidation wave
BTC dropping below $68,000 triggered over $1.23 billion in cryptocurrency liquidations, with $1.09 billion in long positions forcibly closed.
This chain reaction of liquidations can create a vicious cycle: price drops → long positions liquidated → price continues to drop → more liquidations.
A significant part of the current drop is affected by this mechanism rather than actual selling.
Heavyweight Three: May ETF sets worst outflow record of the year
The fear and greed index has dropped to 25; May saw net outflows of about $2.4 billion from spot ETFs, marking the worst monthly performance of 2026.
However, it is worth noting that BlackRock’s iShares Bitcoin Trust (IBIT) holds 794,428 BTC alone, making it the largest institutional Bitcoin holder worldwide; this structural depth still exists.
Short-term adjustments by institutions do not equal institutions exiting the market.
Heavyweight Four: Funds flowing to AI stocks
Funds are shifting from the cryptocurrency market to tech stocks represented by AI, which is one of the most significant capital rotation characteristics of the first half of 2026.
However, this rotation is temporary; funds will ultimately seek higher returns.
Heavyweight Five: Four-year cycle patterns
Analyst Davis pointed out that BTC's drop is a normal manifestation of the four-year cycle. Historically, Bitcoin has experienced significant pullbacks after bull market peaks, and the timing of cycles still has the most substantial influence on price movements.
From this perspective, the current pullback is not the end, but rather a buildup before the next rise.
Technical Outlook: What is the significance of $61,500?
Key Support Analysis
Polymarket forecasting data suggests a 77% probability that BTC will find support around $65,000, with a 54% probability of reaching $62,500 this month.
Today, BTC has touched $61,500, currently within the key support area predicted by the market.
Support levels:
$60,000~$62,500: The most critical support zone currently, psychological barrier + on-chain position cost aggregation zone
$57,500~$58,000: If $60,000 is lost, the next line of defense
$55,000: Extreme scenario support
Resistance levels:
$65,000: Short-term first resistance; returning above it suggests confidence can be tentatively restored
$69,000~$70,000: Medium-term significant resistance; recently lost support level
$76,400~$76,700: Three moving averages resistance zone; reclaiming this would shift the trend to bullish
RSI: Entering an extremely oversold area
The current RSI has fallen below 30, entering an extremely oversold area.
Historical data suggests that each time BTC's RSI falls into extreme oversold territory, a significant rebound often occurs within a few days.
This does not guarantee that the bottom has been reached, but it signifies that selling momentum is waning.
Volume: Driven by liquidation rather than active selling
Today's trading volume has significantly increased, but it is primarily driven by the $1.23 billion liquidation, rather than institutions actively selling.
A drop driven by liquidations vs. a drop due to active selling has completely different natures.
The former usually rebounds quickly after the liquidation ends, while the latter represents genuine downward trends.
Three scenario projections
Scenario One: $60,000 holds, rebound starts (Probability 50%)
Trigger conditions: Effective holding within the $60,000~$62,500 range, end of the liquidation wave, and RSI showing a bullish divergence
Target path:
First target: $65,000 (recovering the short-term first resistance)
Second target: $69,000~$70,000
Third target: If June can reclaim $76,000, the end-of-month target could look to $79,000~$82,000
Altcoin correlation: A BTC rebound will lead to a general rise in altcoins, with lower-priced meme coins potentially rising by 50%~200%
Scenario Two: $60,000 consolidates and bottoms (Probability 30%)
Trigger conditions: Repeated oscillation within the $58,000~$63,000 range
Subsequent developments:
The wave of liquidations gradually ends, and panic sentiment is digested
Structural opportunities in altcoins continue to arise, as seen in OPN's 68.8% increase today
Quantitative models signal the highest quality during panic periods
Scenario Three: Drops below $60,000 (Probability 20%)
Trigger conditions: Panic sentiment continues to spread, whales continue to sell
Polymarket data indicates probabilities of 12% and 7% for $57,500 and $55,000 respectively; extreme drops are not the mainstream expectation.
If it drops to $55,000~$57,500, it will be a historically significant buying opportunity.
Why did BTC fall sharply while OPN rose by 68%?
Today’s market left many people feeling utterly hopeless.
Yet our model issued a signal for OPN today.
Warning price $0.1433, reached $0.2419 after 8 hours, +68.8%.
Why can OPN rise against the trend at the most fearful moment in the market?
Because the main players do not look at emotions; they focus on the chip structure.
When BTC is crashing and retail investors are panicking and fleeing, the main players quietly build their positions in low-level altcoins.
What our quantitative model captures are the traces of these main players building positions:
✅ Volume explosion K-line at the lower Bollinger Band — a signal of large-scale buying by the main players, with volume being 3.8 times the 20-day average ✅ Continuous volume expansion — sustained influx of funds with a clear direction ✅ Fibonacci 0.618 support level accurately supported — risk-reward ratio at the optimal position
These three signals occurring simultaneously led to OPN rising **+68.8%** in 8 hours.
Recent complete performance
Coin | Signal Alert Price | Highest Price | Highest Increase |
|---|---|---|---|
ALLO | $0.098 | $0.36 | +268% |
H | $0.26 | $0.86 | +231% |
LAB | $6.00 | $16.00 | +167% |
PIEVERSE | — | — | +37.4% (24h) |
MRVL | — | — | +14.3% (8h) |
XLM | $0.17 | $0.29 | +71% |
OPN | $0.1433 | $0.2419 | +68.8% (8h) |
BTC is falling, but signals are rising.
Where is the next opportunity?
BTC today hit a low of $61,500, currently within the key support area predicted by the market.
The more panic there is, the more active the main players are, and the higher the density of our model signals.
The next opportunity at the OPN level may come tonight.
The question is: are you in?
Join the AlphaQuant altcoin signal community
👉 t.me/alphaquant_lixia
After joining, send "OPN" to receive for free:
✅ Full signal screenshot of OPN and entry logic recap
✅ Historical signal records of ALLO +268%, H +231%, LAB +167%
✅ List of potential targets currently being tracked by the model
✅ Daily BTC directional analysis report
Currently free for experience, first come first served.
Today's operational advice
BTC operations:
Conservative type: Build positions in batches within the $60,000~$62,500 range, stop loss below $57,000, wait for a rebound
Aggressive type: Wait for an effective breakout above $65,000 to enter, target $69,000~$72,000
Conservative type: Wait for RSI to return above 35, confirm the end of the liquidation wave before entering
Altcoin layout:
This current phase is the most active stage for the main players in altcoins during BTC's sharp decline
Focus on lower-priced coins with Bollinger Bands showing volume explosion and unusual trading volume
Strictly control a single position within 10% of total funds
Don’t miss out on altcoin opportunities just because BTC is falling; today’s OPN is the best example
Disclaimer: The content of this article is for learning reference only and does not constitute any investment advice. The cryptocurrency market is highly risky; past signal performance does not represent future returns; please make independent judgments based on your own risk tolerance.
#BTC #Bitcoin #OPN #Altcoins #QuantitativeSignals #AlphaQuant #TechnicalAnalysis #Cryptocurrency #Liquidation
免责声明:本文章仅代表作者个人观点,不代表本平台的立场和观点。本文章仅供信息分享,不构成对任何人的任何投资建议。用户与作者之间的任何争议,与本平台无关。如网页中刊载的文章或图片涉及侵权,请提供相关的权利证明和身份证明发送邮件到support@aicoin.com,本平台相关工作人员将会进行核查。