Crypto Circle Scholar: After a sharp drop in Bitcoin to 6.5, there are traps everywhere for bottom fishing! Analyzing the Bitcoin trend at 64000, is it clear at a glance? Latest market analysis and operation suggestions
The current price of Bitcoin is 63750. After every significant drop, there are always a bunch of friends heavily invested in bottom fishing, always wanting to catch the lowest point for a double, but in the end, they end up getting deeply trapped and forced to sell at a loss. Now, the BTC long-term trend is heading south, and the short-term rebound is merely a recovery from overselling. Do not mistake the short-term warming as the beginning of a bull market. In crypto trading, making big money relies on following the trend, while losing big money is all about going against the trend and holding heavily. If you can't understand the trend, trade less; it's better to miss a short-term profit than to blindly bet on the bottom. Protecting your capital is always more important than catching one surge; taking it slow and steadily making profits is the long-term strategy.
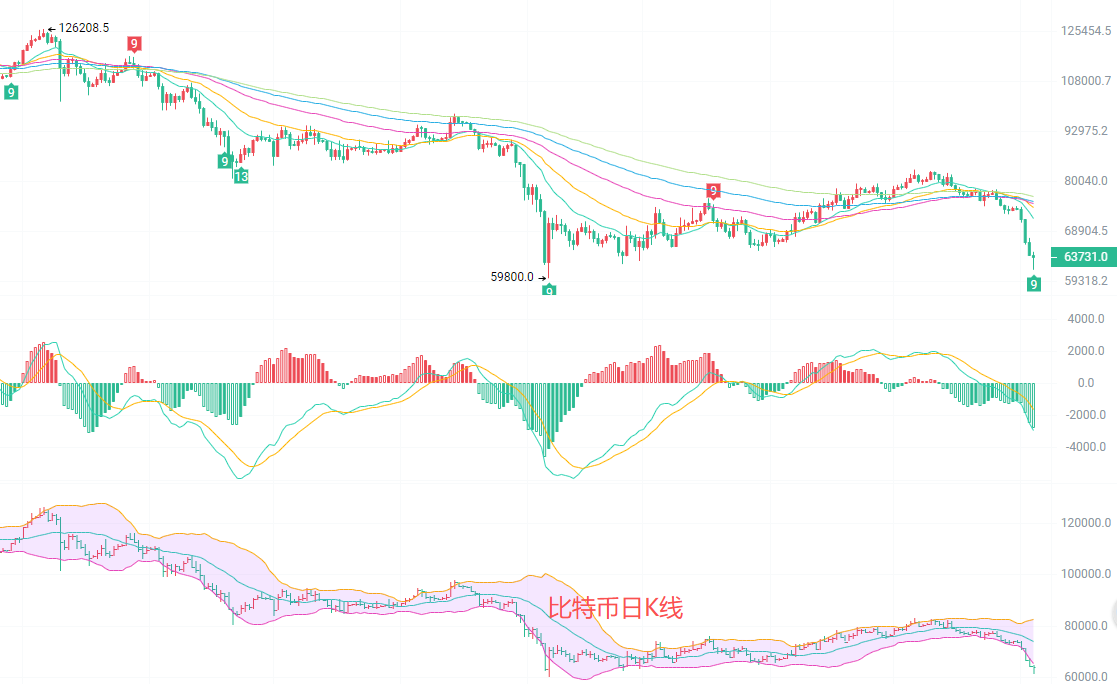
The daily K-line formed a small cross bearish yesterday, with a lowest point of 61344. All EMA moving averages on the chart are arranged southward. The short-term 15 and 30 cycle moving averages are firmly pressuring at 71400 and 74080. The price repeatedly broke below the lower Bollinger Band at 65607, in a downward Bollinger Band channel. The MACD indicators DIF and DEA are all below the zero line, with green bars continuously increasing, and the downward momentum remains strong. The daily trend is clearly bearish, with heavy moving averages above forming significant resistance. It is challenging to reverse the trend quickly in the short term; the primary rebound resistance level is at 67000.
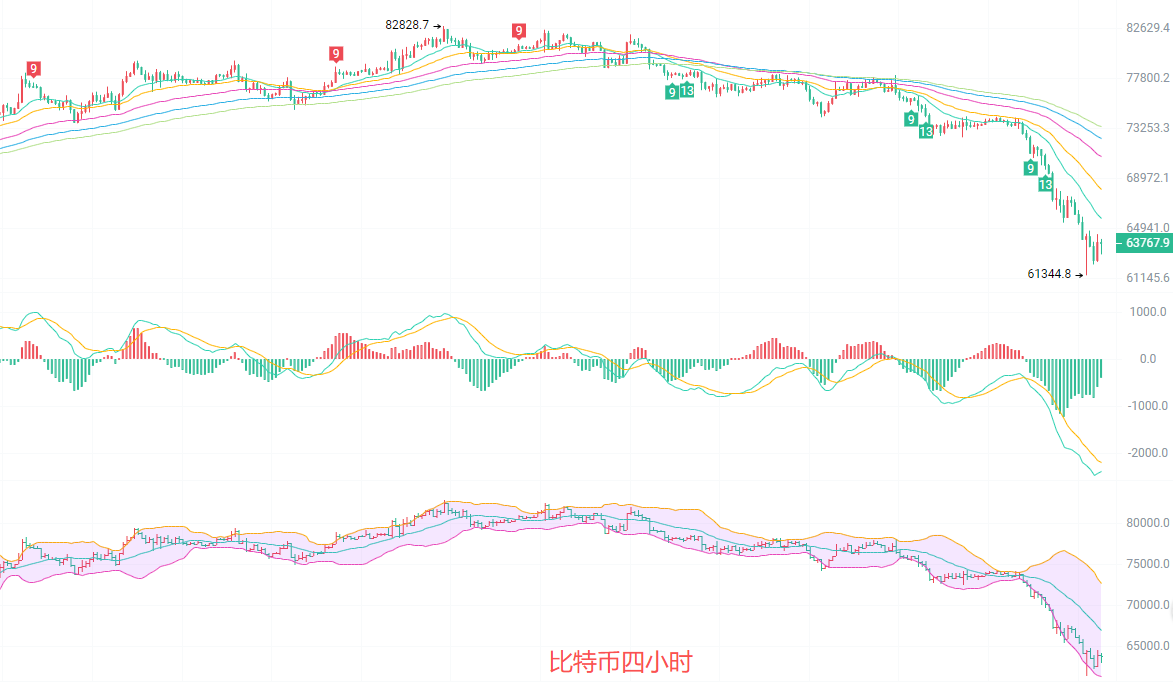
The four-hour K-line stopped falling and slightly rose, with MACD showing minor signs of bottom divergence recovery. The price is running above the 4-hour Bollinger lower track at 61353, with the Bollinger Band opening continuing to point downward, and the broad range downward formation remains unchanged. The short-term EMA moving averages have all turned down, forming a pressure zone. The first resistance above is at 67000, and the second resistance at 70000. The MACD green bars are shorter than before, and DIF is close to DEA, showing signs of a golden cross, indicating a short-term demand for rebound recovery, but it is just a correction after the drop. Once the rebound ends, it is highly probable to continue downward; do not misjudge the short-term rebound as a reversal.
Short-term strategy reference: follow the long-term trend, with small stop-losses and quick entries and exits.
Position from 63200 to 62700 upwards, stop-loss at 62000, target at 65800 to 67200.
Position from 66800 to 67300 downwards, stop-loss at 68500, target at 65500 to 64500.
Specific operations should be based on real-time market data. For more information, you can consult the author. The article has a delay in publication; suggestions are for reference only, and risks are borne by the reader.

Warm reminder: The above content is solely created by the author on Weibo. The advertisements at the end of the article and in the comments section are unrelated to the author. Please be cautious in distinguishing, thank you for reading.
免责声明:本文章仅代表作者个人观点,不代表本平台的立场和观点。本文章仅供信息分享,不构成对任何人的任何投资建议。用户与作者之间的任何争议,与本平台无关。如网页中刊载的文章或图片涉及侵权,请提供相关的权利证明和身份证明发送邮件到support@aicoin.com,本平台相关工作人员将会进行核查。