1. News Front: Macro Fog Thickens, Pressure Bias Amid Long and Short Intertwined
Macro Data and Geopolitics (Mainly Bearish): Today, the geopolitical situation unexpectedly escalated, with the US military conducting multiple airstrikes against Iran, leading to risk-averse sentiment that put pressure on US stocks and the cryptocurrency market. Meanwhile, the entire market is closely awaiting the US May CPI data about to be released. Before the key macro storm settles, fund observation sentiment is extremely strong, and bulls dare not act blindly.
Capital Flows and Capital Competition (Bearish): In the first week of June, the cryptocurrency market experienced a significant setback, with large amounts of capital exiting from Bitcoin and Ethereum spot ETFs. Additionally, the current global AI competition has a significant capital attraction effect, along with the upcoming major technology stock IPOs (such as SpaceX) distracting risk capital, leading to a temporary lack of liquidity in the cryptocurrency market.
Institutional Trends and On-chain Fundamentals (Medium to Long Term Bullish): Although the short-term market is under pressure, large on-chain spot whales are showing exceptionally high resilience. Even in a state of unrealized losses, large Ethereum trusts and core holders such as BitMine are still announcing plans to continue financing through staking and other methods of "firm buying." However, this long-term locked position confidence is difficult to rapidly convert into a short-term breakout power within 24 hours.
2. Technical Front: One-Hour Level Bulls Cut Short, Pattern Returns to Weak Downward
Based on the provided TradingView one-hour candlestick chart:
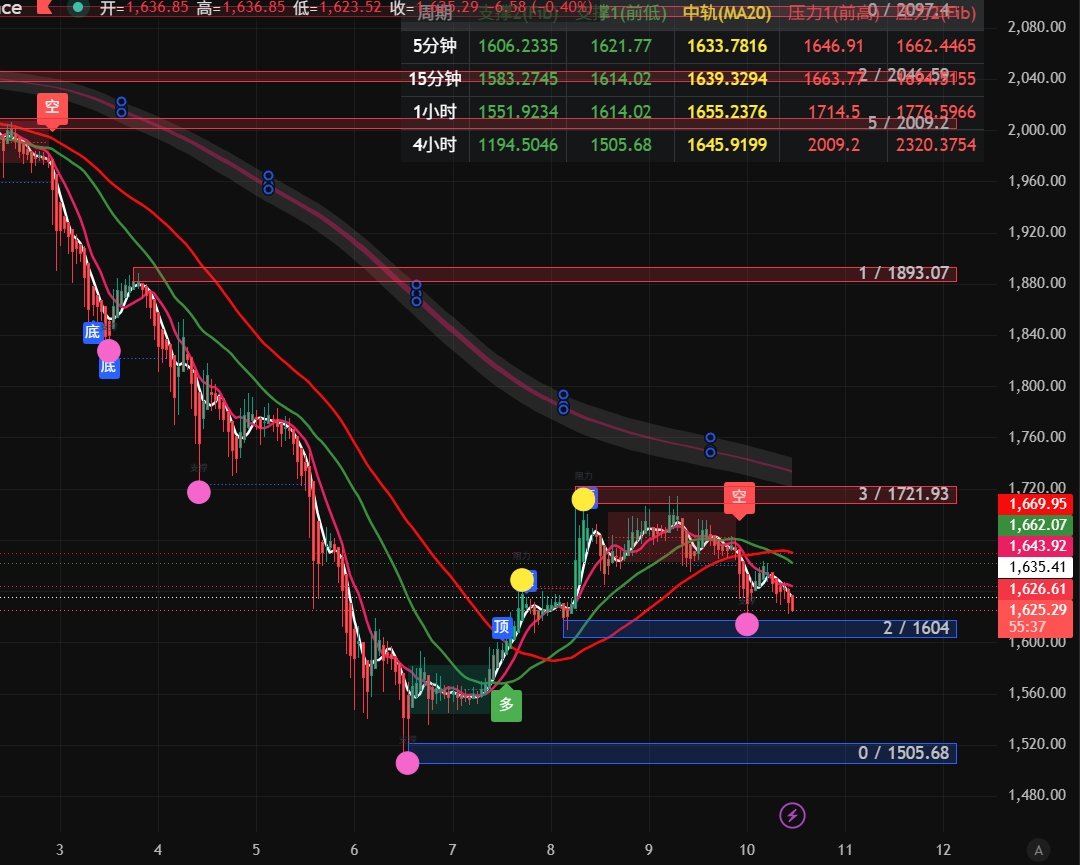
Current Price and Candlestick Pattern: Currently, the Ethereum spot price is around 1,625.31 USD. From the candlestick combination pattern, it had a wave of oscillating rebounds after touching the low near 1,520 USD a few days ago, but it was clearly obstructed around 1,720 USD. The current candlestick shows a continuous bearish decline, once again breaking through the previous rebound platform, indicating that the earlier rebound logic has been damaged.
Moving Average System:
The thicker red long-term moving average in the chart still maintains an extremely steep downward slope, indicating the bullish market suppression force of the larger trend.
The short-term moving average system has formed a death cross downward divergence after intertwining at the rebound high (near 1,671 - 1,664 USD).
The price is currently firmly pressed below all short-term and long-term moving averages, representing a typical bearish arrangement.
Key Support and Resistance Levels:
Core Resistance Levels:
First Resistance (Short-term): 1,645 USD (Moving average intertwining pressure zone).
Strong Resistance: 1,671 USD / 1,720 USD (Previous rebound high and long-term concentrated transaction zone).
Core Support Levels:
First Support: 1,600 USD (Psychological integer level).
Strong Support: 1,520 USD (Powerful pin low position before and after June 7).
Technical Indicators (MACD / RSI / Bollinger Bands Indications):
The candlestick is running just below the middle track of the Bollinger Bands and beginning to open towards the lower track, with a strong willingness for shorts to test downward.
MACD shows a trend toward a second death cross or downward divergence below the zero axis, with momentum bars turning red, and short power is being re-accumulated.
3. Operational Direction: Focus on Defense, Watch More, Act Less (Batch Strategy)
Due to the imminent release of macro CPI data and the turbulent geopolitical situation, aggressive buying in the short term is not recommended. A high short or probing bottom batch defense strategy should be adopted.
Long Position Entry / Addition Points:
Aggressive Attempt to Go Long: If the price receives a significant stop-loss signal at the 1,600 USD integer threshold (such as a long lower shadow appearing on the 15-minute level), a very small position of 1% can be taken to gamble on a rebound.
Conservative Buy (Spot or Low Leverage): Wait for a pullback to the previous low area of 1,520 - 1,550 USD to place batch limit orders for left-side position building.
Short Position / Reduction Points:
If the market short-term retracement rises to around 1,645 - 1,660 USD but cannot stabilize, it is an ideal point to reduce long positions or avoid risks on the spot.
Take Profit and Stop Loss Settings:
Long Position Take Profit: Short term looks at 1,665 USD; if a significant volume rebound occurs, then look for 1,710 USD nearby to take profit.
Long Position Strict Stop Loss: 1,500 USD. Once it falls below 1,500 USD, it means the weekly level space is further opened, and bulls must stop loss unconditionally.
Position Management Strategy:
Before major macro events occur within the week, the total position should be compressed to below 15% to 20%. Currently, due to the lack of liquidity in the market, malicious pin washing that leads to disorderly fluctuations is highly likely. Keeping a vacant position or maintaining a very low position is the best protection.
4. Risk Warnings and Response Strategies
Geopolitical and Macro Data Exceeding Expectations (Volatile Risk):
Risk: If tonight's related CPI data from the Federal Reserve is worse than expected, coupled with further deterioration in the Middle East situation, it may directly lead to Ethereum breaking below 1,520 USD, triggering a chain liquidation of bulls.
Countermeasure: Within 2 hours before and after the data release, do not place orders, close high leverage, and spot holders should move assets to safe positions.
Liquidity Exhaustion Leading to "False Breakouts / False Rebounds":
Risk: During the session, there may be a "door shape" trend where prices suddenly rise by dozens of dollars due to thin institutional order books and then quickly fall back.
Countermeasure: Refuse to chase highs on the right side. Any rapid rise not accompanied by a continuous increase in trading volume (such as the trading volume in the bottom right corner of the chart remaining below the average line) should be regarded as a bait for bullish sentiment, and blind chasing of prices should be avoided.
This article is provided by: Meridian Analysis. To learn more about the cryptocurrency and foreign exchange information, scan the QR code to follow the public account and communicate with me. There may be delays in article sending, and content is for reference only. I have years of research experience in cryptocurrency and foreign exchange, and everyone is welcome to learn.
免责声明:本文章仅代表作者个人观点,不代表本平台的立场和观点。本文章仅供信息分享,不构成对任何人的任何投资建议。用户与作者之间的任何争议,与本平台无关。如网页中刊载的文章或图片涉及侵权,请提供相关的权利证明和身份证明发送邮件到support@aicoin.com,本平台相关工作人员将会进行核查。


