Dear friends, I am Qinglan. The market situation this morning is very clear. The expectation of an interest rate hike by the Bank of Japan is rising, which may trigger the liquidation of yen carry trades, and this is the current market's most critical bearish logic. Meanwhile, the escalating situation between the US and Iran has led to a spike in oil prices, further suppressing risk assets due to increased risk aversion. These two pieces of news combined explain why Bitcoin, after rebounding to $62,000, still appears to be struggling. Market sentiment is extremely weak, with the Fear and Greed Index at only 12, indicating that both retail and institutional investors are waiting on the sidelines. In this context, our analysis must be more rigorous, and we cannot blindly chase after prices.
Current Price and Time
The current time is June 11, 11:25 AM, and Bitcoin is priced at 62,100 USDT. The 24-hour increase is 1.1%, indicating a weak rebound. The market share is 56.18%, showing that funds are still concentrated in Bitcoin, while altcoin liquidity is poor. This price level is exactly near the 1-hour EMA55, characterized by typical line proximity fluctuations, with strong competition between bulls and bears.
Multi-Timeframe Overview
First, let's look at the daily chart. The daily MACD's DIF is -4108, the DEA is -3529, and the histogram is -578, indicating that bearish momentum is still strong. The RSI is only 18.77, which is in the extremely oversold zone, showing that the price has strayed far from the moving averages, but being oversold does not mean an immediate reversal; rather, it suggests that the room for decline may be limited. The daily MA5 is at 62,351, MA10 is at 62,848, and MA30 is at 71,857, with moving averages in a bearish order; the overall trend remains bearish.
4-Hour Level. The 4-hour MACD's DIF is -385, the DEA is -432, and the histogram is 46. Although still below the zero line, the histogram is shortening, indicating that bearish momentum has somewhat weakened. The RSI is 42.53, in a neutral to weak territory. The 4-hour MA5 and MA10 are around 61,845 and 61,742, forming short-term support, but MA30 is at 62,129, and the price is currently oscillating near MA30, needing to be observed for stability.
1-Hour Level. The 1-hour MACD's DIF is 17, the DEA is -42, and the histogram is 59, having formed a golden cross; this signals a short-term rebound. The RSI is at 49.19, neutral. EMA55 is at 62,027, and the current price of 62,100 is just above EMA55. However, note that in the past 8 1-hour candlesticks, the closing price was above EMA55 only 3 times, with one crossover, and the price is 0.12% away from EMA55, indicating line proximity fluctuations, increasing the probability of consolidation.
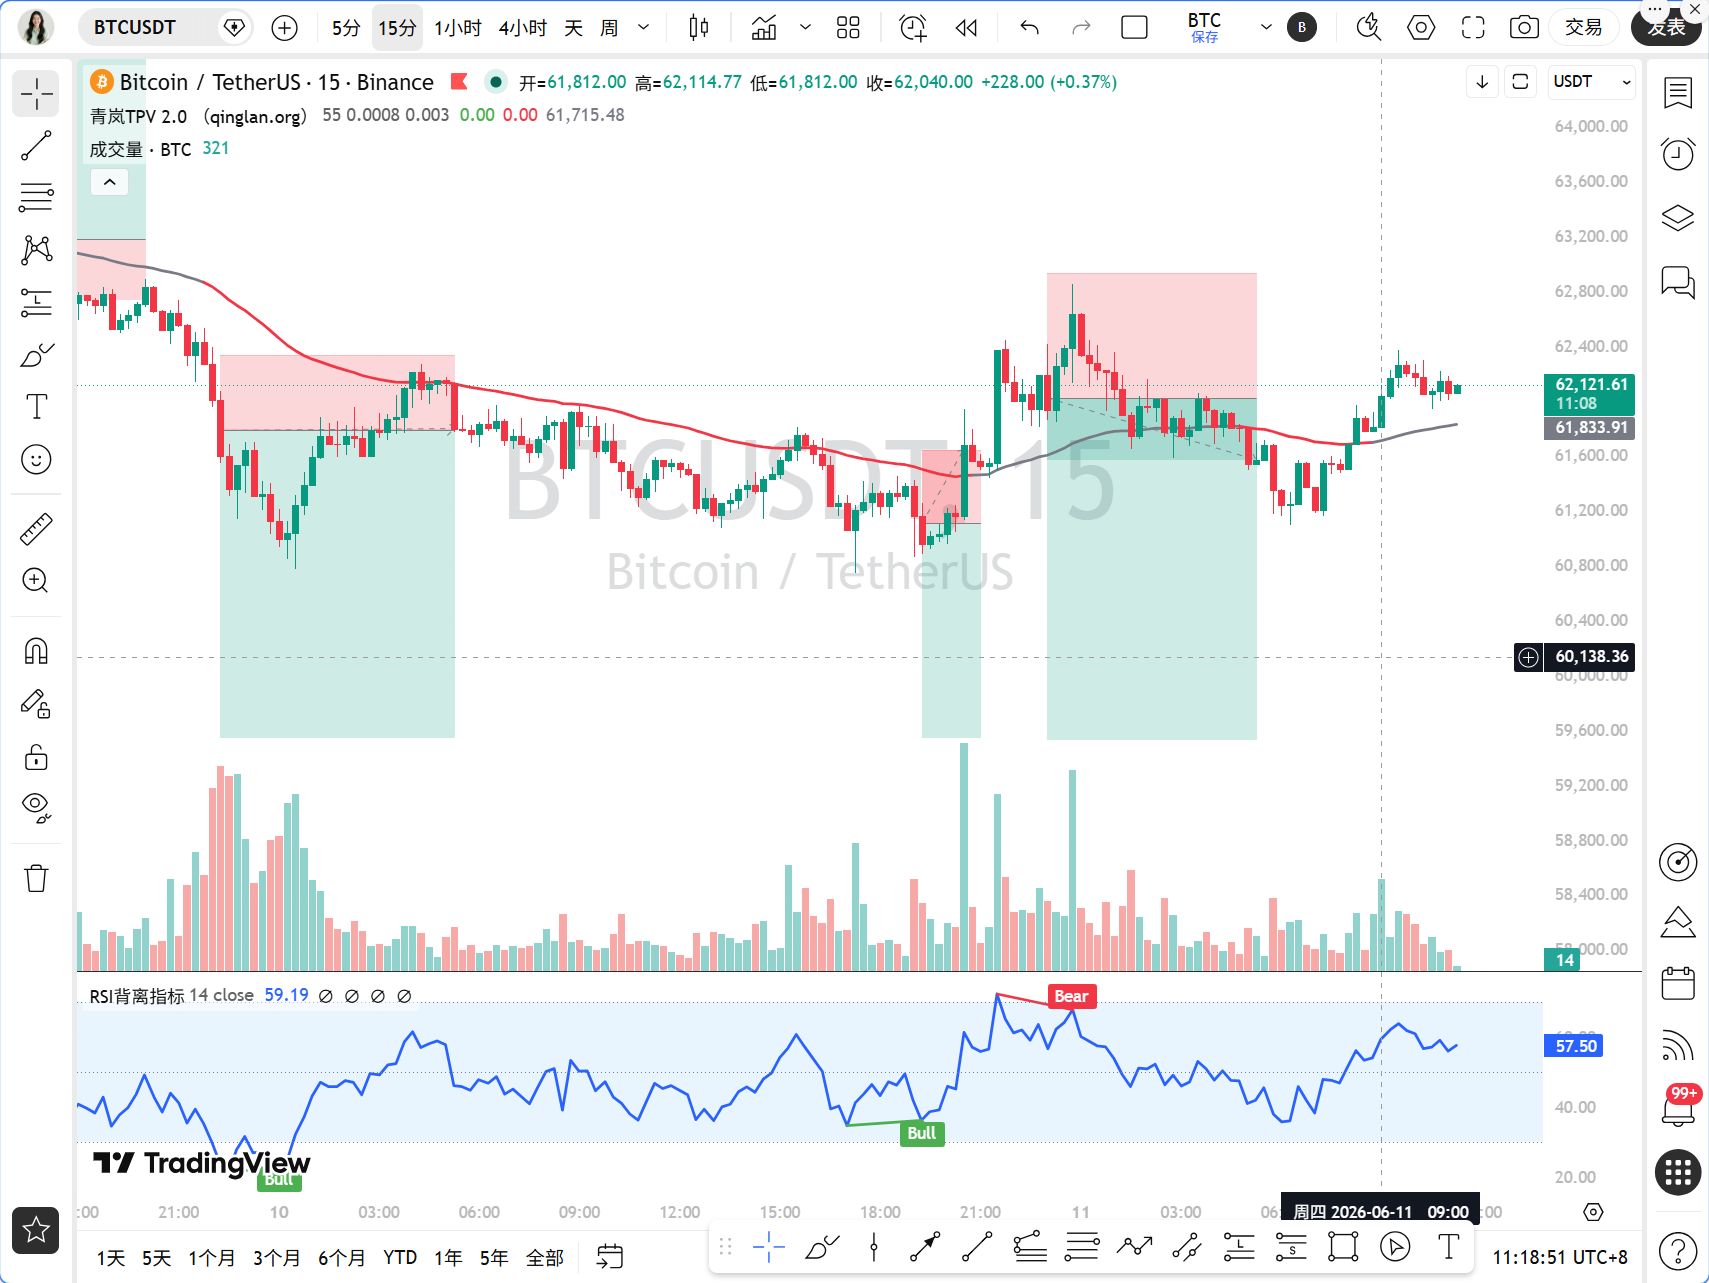
15-Minute Level. The 15-minute MACD's DIF is 115, the DEA is 89, and the histogram is 25, in a golden cross state, but the RSI has reached 71.58, approaching overbought territory, indicating short-term pullback demand. MA5 and MA10 are at 62,089 and 62,131, while MA30 is at 61,774, short-term moving averages in a bullish order, but not strong.
TPV Signal Verification
Now let's use the Qinglan TPV system for verification. The core rule is to use the 1-hour EMA55 as the bull-bear dividing line. The current price of 62,100 is above EMA55 at 62,027, so the trend positioning is in the bullish area. However, note that auxiliary oscillation data shows that in the past 8 1-hour candlesticks, the closing price was above EMA55 3 times, only once crossing it, and the price is fluctuating at 0.12%; although this does not meet the oscillation threshold, proximity fluctuation means that the balance of bull and bear strength cannot be simply seen as a strong bullish force.
Long Position Condition Verification. First, the price stays above the 1-hour EMA55. The current price is above EMA55, but the condition for consecutive 2 1-hour candlestick closing prices being above EMA55 needs observation. The last two 1-hour candlesticks closed at 62,050 and 62,100, both above 62,027, so the condition is satisfied. Second, support stability. Is there a long lower shadow in the 15-minute level? From the data, the 15-minute MA30 is at 61,774, and after recently touching the low around 61,700, it rebounded, forming a small-level bottom divergence, basic conditions for support stability are met. Third, bearish momentum exhaustion. The 1-hour MACD histogram has shortened from -42 to 17 over two consecutive periods, and the RSI has risen from below 30 to 49; although the bullish engulfing pattern is not obvious, exhaustion conditions are partially met. Overall, the long position conditions have support, but the strength is relatively weak.
Short Position Condition Verification. First, the price is under pressure below the 1-hour EMA55. The current price is above EMA55, so the condition is not met. Second, resistance encountered. The 15-minute RSI is close to overbought territory, which may form short-term resistance, but at the hourly level, there is no obvious top divergence. Third, weak rebound. The MACD histogram is still increasing and has not consecutively shortened. Thus the short position conditions are not valid.
Oscillation Handling. Due to price proximity fluctuations and few crosses, although it does not meet the oscillation threshold, operation must be cautious, and heavy positions should not be added. The Qinglan TPV system recommends that during oscillation trading, do not actively long or short, but just provide a range. The current upper range is near 62,500, and the lower range is near 61,500.
On-Chain Funding Situation
Regarding on-chain data, the Fear and Greed Index is at 12, indicating extreme fear. This is a typical characteristic of a bottom area, but bottoms often require time to grind. A large whale has withdrawn over 3,000 BTC from exchanges in the last 5 days, showing an increased willingness to accumulate, which is a positive sign, but the short-term price reaction is not obvious. Gold has surged past $4,113, diverting risk aversion funds, which is pressuring BTC. Overall, the funding situation is neutral; whale accumulation provides support, but macro bearish pressures suppress rebound space.
Key Attack and Defense Levels
The key resistance above is at 62,500, which overlaps with the 4-hour MA30 and previous minor highs. If it breaks above 62,500, the next target is at 63,500, near the daily MA5. The key support below is at 61,500, which is the support area for the 15-minute MA30 and the 1-hour EMA55. If it falls below 61,500, it may test 61,000 or even the 60,000 integer mark. Note that the daily RSI is only 18.77; if the price drops below 60,000, it may trigger a rebound due to overselling, but the trend remains bearish.
Trading Idea
Based on the TPV system, we are currently in a bullish trend area but experiencing line proximity fluctuations, so operations should focus on short trades, with strict stop losses.
Direction: Short-term biased towards long positions, but positions should be light.
Entry Conditions: Wait for the price to retrace to the 61,500-61,700 area, showing a 15-minute level bottom divergence or a long lower shadow, while MACD histogram shortens consecutively over 2 periods, we can lightly enter a long position. If the price directly breaks above 62,500 and stabilizes, we can also chase long, but the risk is higher.
Stop Loss Level: After entering a long position, set the stop loss at 61,300; exit if it drops below. If chasing long, set the stop loss at 62,200.
Target Levels: First target at 62,500, second target at 63,500. If the price is blocked near 62,500 and shows a 15-minute top divergence or a long upper shadow, partial profit-taking can be performed.
If the price drops below 61,500, abandon the long position and wait on the sidelines. If the price oscillates in the 61,500-62,500 range, do not operate and wait for a breakout.
Risk Reminder
Current macro bearish factors are dense; the Bank of Japan's interest rate hike and geopolitical conflicts may trigger flash crashes at any time. Every trade must set a stop loss; do not hold losses.
Follow Qinglan Crypto Classroom to seize more trading opportunities! Welcome to visit the official website www.qinglan.org
📊 Qinglan TPV Trading Strategy Backtest Reference
🕒 Last Backtest Time 06-11 07:00:02
Total Analysis: 2164 Backtests: 1753 Accuracy: 69.5% (1219/1753)
免责声明:本文章仅代表作者个人观点,不代表本平台的立场和观点。本文章仅供信息分享,不构成对任何人的任何投资建议。用户与作者之间的任何争议,与本平台无关。如网页中刊载的文章或图片涉及侵权,请提供相关的权利证明和身份证明发送邮件到support@aicoin.com,本平台相关工作人员将会进行核查。


