Let’s talk about something that happened early this morning
At exactly 5 AM today, our community sent out a signal — XPL/USDT.
Warning price: $0.0709 8 hours later price increase: +21.8%
Even while BTC remains in the historically oversold zone, the signal has continued to yield stable profits.
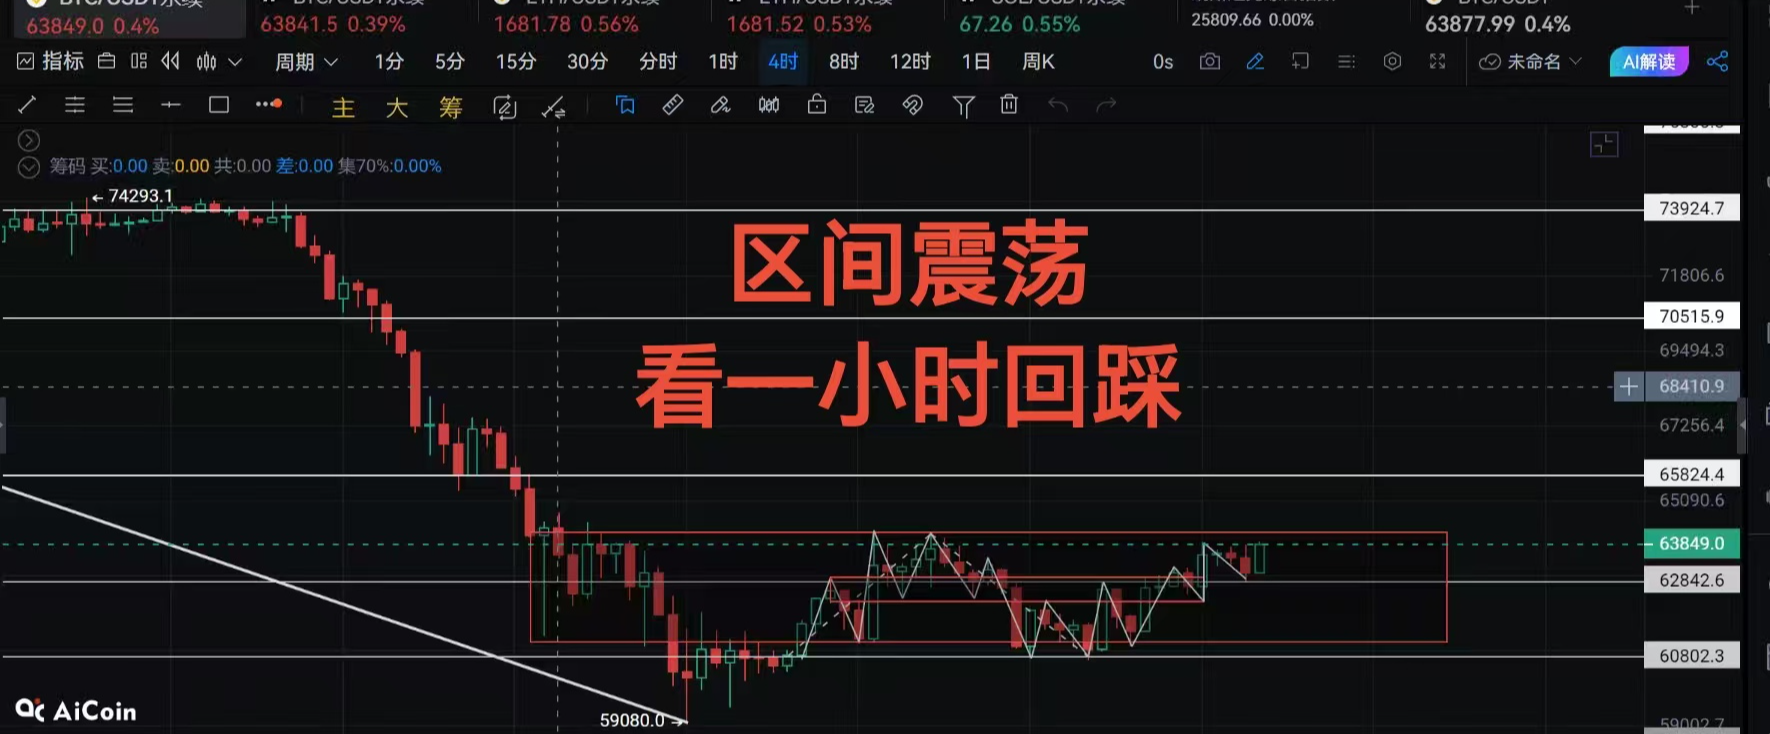
Today's BTC: $63,470, what is happening?
The current price of BTC is $63,470. Reviewing this week's movements:
June 6: Dropped to a low of **$59,200**, the lowest since 2024
June 8: Rebounded to a high of **$64,000**
Today: Standing at **$63,470**, fluctuating near the rebound's high
This week’s movements resemble a "panic followed by recovery" process — the market aggressively tested the support below, then rebounded with the same force.
Technical aspect: Key support and resistance levels are clear
Today's precise support and resistance levels
Based on classic pivot points calculated today:
Support levels:
$62,223: First support
$60,822: Second support
$60,056: Strongest support, corresponding to recent low area
Resistance levels:
$64,390: First resistance
$65,157: Second resistance
$66,557: Third resistance, the upper edge of this month's technical analysis target
Current price $63,470 is positioned between support and resistance, with no clear direction yet, but the upward resistance level is closer, indicating that the focus for short-term speculation is at $64,390.
RSI: 23.53, oversold signal remains valid
The current RSI reading is 23.53, remaining in the oversold region. The 50-day moving average is expected to drop to $74,678 next month, and the 200-day moving average is expected to fall to $76,444.
The RSI has been in the oversold region for a long time, indicating that selling pressure is gradually exhausting, but no clear reversal signal has appeared.
A positive signal: Volatility drops to a year-low
Bitcoin's 9-month realized volatility has dropped to a year-low. The decrease in volatility may indicate the market is maturing, even though outflows from ETFs and macro uncertainties persist.
Lower volatility + prices stabilizing above support = the market is pausing, not collapsing.
Where is BTC now?
The current trading price of BTC is in one of the most important price ranges of this cycle, having returned to the $60,000 liquidity area after a significant correction from previous highs. Historically, this area has attracted a large amount of buying activity and institutional interest.
Although short-term market sentiment remains cautious, many long-term investors are closely watching whether this correction will become one of the most attractive entry opportunities for Bitcoin in 2026.
In simple terms:
The position BTC is in now is one of the areas where "smart money" has favored buying over the past few years.
Cautious short-term sentiment does not mean poor long-term opportunities.
Three scenario projections
Scenario one: Break above $64,390, initiating a rebound (probability 50%)
Trigger condition: Closing price effectively breaks above the first resistance level at $64,390, with volume increasing simultaneously
Target path:
First target: $65,157~$66,557 (upper edge of this month's target range)
Second target: $69,000~$70,000
Third target: If RSI returns above 40, the prediction model gives a target range of $74,000~$81,000
Altcoin linkage: A BTC breakthrough will drive a rise across altcoins, with lower-bound tokens potentially rising by 50%~200%
Scenario two: Fluctuation between $62,223~$64,390 (probability 35%)
Trigger condition: Bulls and bears repeatedly battling between support and resistance
Subsequent development:
Volatility remains low, and market sentiment gradually recovers
Structural opportunities in altcoins continue to emerge, similar to the +21.8% in 8 hours for XPL this morning
Quantitative models generate the most signals in the fluctuation zone
Scenario three: Break below $62,223, retesting $60,056 (probability 15%)
Trigger condition: Increasing macro pressure, expanding ETF outflows
Subsequent development:
$60,056 is the strongest support this month, corresponding to recent low area
If it tests $59,200 again, a double bottom structure will form, making the technical aspect even stronger
Extreme areas often represent the best positioning windows
Why is BTC still in the oversold region, but XPL can rise 21.8% in 8 hours?
Many people see the RSI at 23.53 and the first reaction is, "The market is still falling, don't act yet."
But our model looks at a different set of data.
This morning at 5 AM, the model detected that XPL triggered three signals simultaneously:
✅ Bollinger Bands lower boundary explosive volume candle — Clear signs of major positions being established, with volume far exceeding the 20-day average ✅ Volume continues to expand — Confirmed direction of capital inflow ✅ Key Fibonacci support level is supported — Optimal risk-reward ratio
8 hours later: +21.8%.
The oversold zone of BTC is precisely the timeframe when altcoin major positions are densely established.
Recent complete performance
Currency | Signal alert price | Maximum increase |
|---|---|---|
ALLO (first time) | $0.098 | +268% |
H (first time) | $0.26 | +231% |
LAB | $6.00 | +167% |
ALLO (again) | $0.2245 | +80.2% (8h) |
OPN | $0.1433 | +68.8% (8h) |
BSB | $0.2598 | +55.0% (8h) |
PIPPIN | $0.0198 | +40.3% (8h) |
XLM | $0.17 | +71% |
H (again) | $0.5850 | +17.6% (24h) |
HMSTR | $0.0002 | +17.4% (24h) |
SENT | $0.0149 | +15.7% (4h) |
PARTI | $0.0519 | +10.4% (4h) |
XPL | $0.0709 | +21.8% (8h) |
13 signals, BTC has oscillated repeatedly in the oversold zone, with signals continuously profiting.
When will the next opportunity arise?
BTC's volatility has dropped to a year-low, and the market is stabilizing in the $60,000 liquidity area.
This is precisely the area where "smart money" has historically favored building positions.
The next signal at the level of XPL could happen today.
The question is: Are you in?
Join the AlphaQuant altcoin signal community
👉 t.me/alphaquant_lixia
After joining the group, send the words "signal" to receive for free:
✅ Complete signal screenshot and entry logic review for XPL
✅ Historical records of all 13 recent signals (including screenshots)
✅ List of potential targets currently tracked by the model
✅ Daily BTC direction analysis report
Currently open for free experience, first come first served.
Today's operation suggestions
BTC operations:
Conservative: Build positions in $62,200~$63,500 range in batches, with a stop loss below $60,000
Aggressive: Wait for an effective breakout above $64,390 before entering, target $65,157~$66,557
Conservative: Wait for RSI to return above 35, confirm oversold recovery signals before entering
Altcoin positioning:
BTC stabilizing in the $60,000 liquidity area represents a historical-level window for altcoin positioning
Focus on low-position coins with explosive volume at the Bollinger Bands lower boundary and abnormal trading volume
Control any single position strictly within 10% of total funds
This morning's +21.8% rise of XPL in the oversold zone of BTC is the best example
Disclaimer: The content of this article is for learning reference only and does not constitute any investment advice. The cryptocurrency market is highly risky, past performance does not guarantee future returns, please make independent judgments based on your own risk tolerance.
#BTC #Bitcoin #XPL #Altcoins #Quantitative Signals #AlphaQuant #Technical Analysis #Cryptocurrency
免责声明:本文章仅代表作者个人观点,不代表本平台的立场和观点。本文章仅供信息分享,不构成对任何人的任何投资建议。用户与作者之间的任何争议,与本平台无关。如网页中刊载的文章或图片涉及侵权,请提供相关的权利证明和身份证明发送邮件到support@aicoin.com,本平台相关工作人员将会进行核查。