Dear friends, I am Sister Qinglan. This morning I opened the market and saw two major news pieces directly affecting market sentiment. One is that Castle Securities predicts the Federal Reserve might raise interest rates by 75 basis points this year, possibly in September, which has brought strong bearish pressure to risk assets. The other is that Grayscale deposited 1863 BTC into Coinbase, worth 124 million USD. Such large transfers to exchanges often signal potential selling pressure. These two pieces of news combined have put pressure on BTC, which is fluctuating around 65906 USD. Market sentiment is extremely fearful, with the Fear and Greed Index at only 23, but data tells us that the more panic there is, the more we need to calmly analyze the structure.
Current Price and Time
The current time is June 17, 10:14 AM, with BTC quoted at 65906 USDT. The 24-hour decline is 0.99%, and the market share is 56.27%. This position is at a mid to low level on the daily scale, but the structure on the hourly scale is undergoing subtle changes.
Multi-Period Status Overview
First, let's look at the daily chart. The daily MA5 is at 65622, MA10 is at 64164, and MA30 is at 69227. The MACD DIF is -2332.87, the DEA is -3023.36, and the histogram is 690.49, indicating that the bearish momentum still exists but has weakened. The RSI is at 56.62, which is in the neutral to weak area. The daily chart overall shows a sideways consolidation after a decline, with no clear trend signals.
On the 4-hour level. The MA5 is at 65919, MA10 is at 66237, and MA30 is at 64977. The MACD DIF is 589.07, DEA is 706.94, and the histogram is -117.87, with a death cross state, indicating that bearish momentum is still being released. The RSI is at 66.24, indicating a retreat from the overbought area, showing that the rebound momentum is weakening. Currently, the 4-hour chart is dominated by bears, but there is MA30 support below.
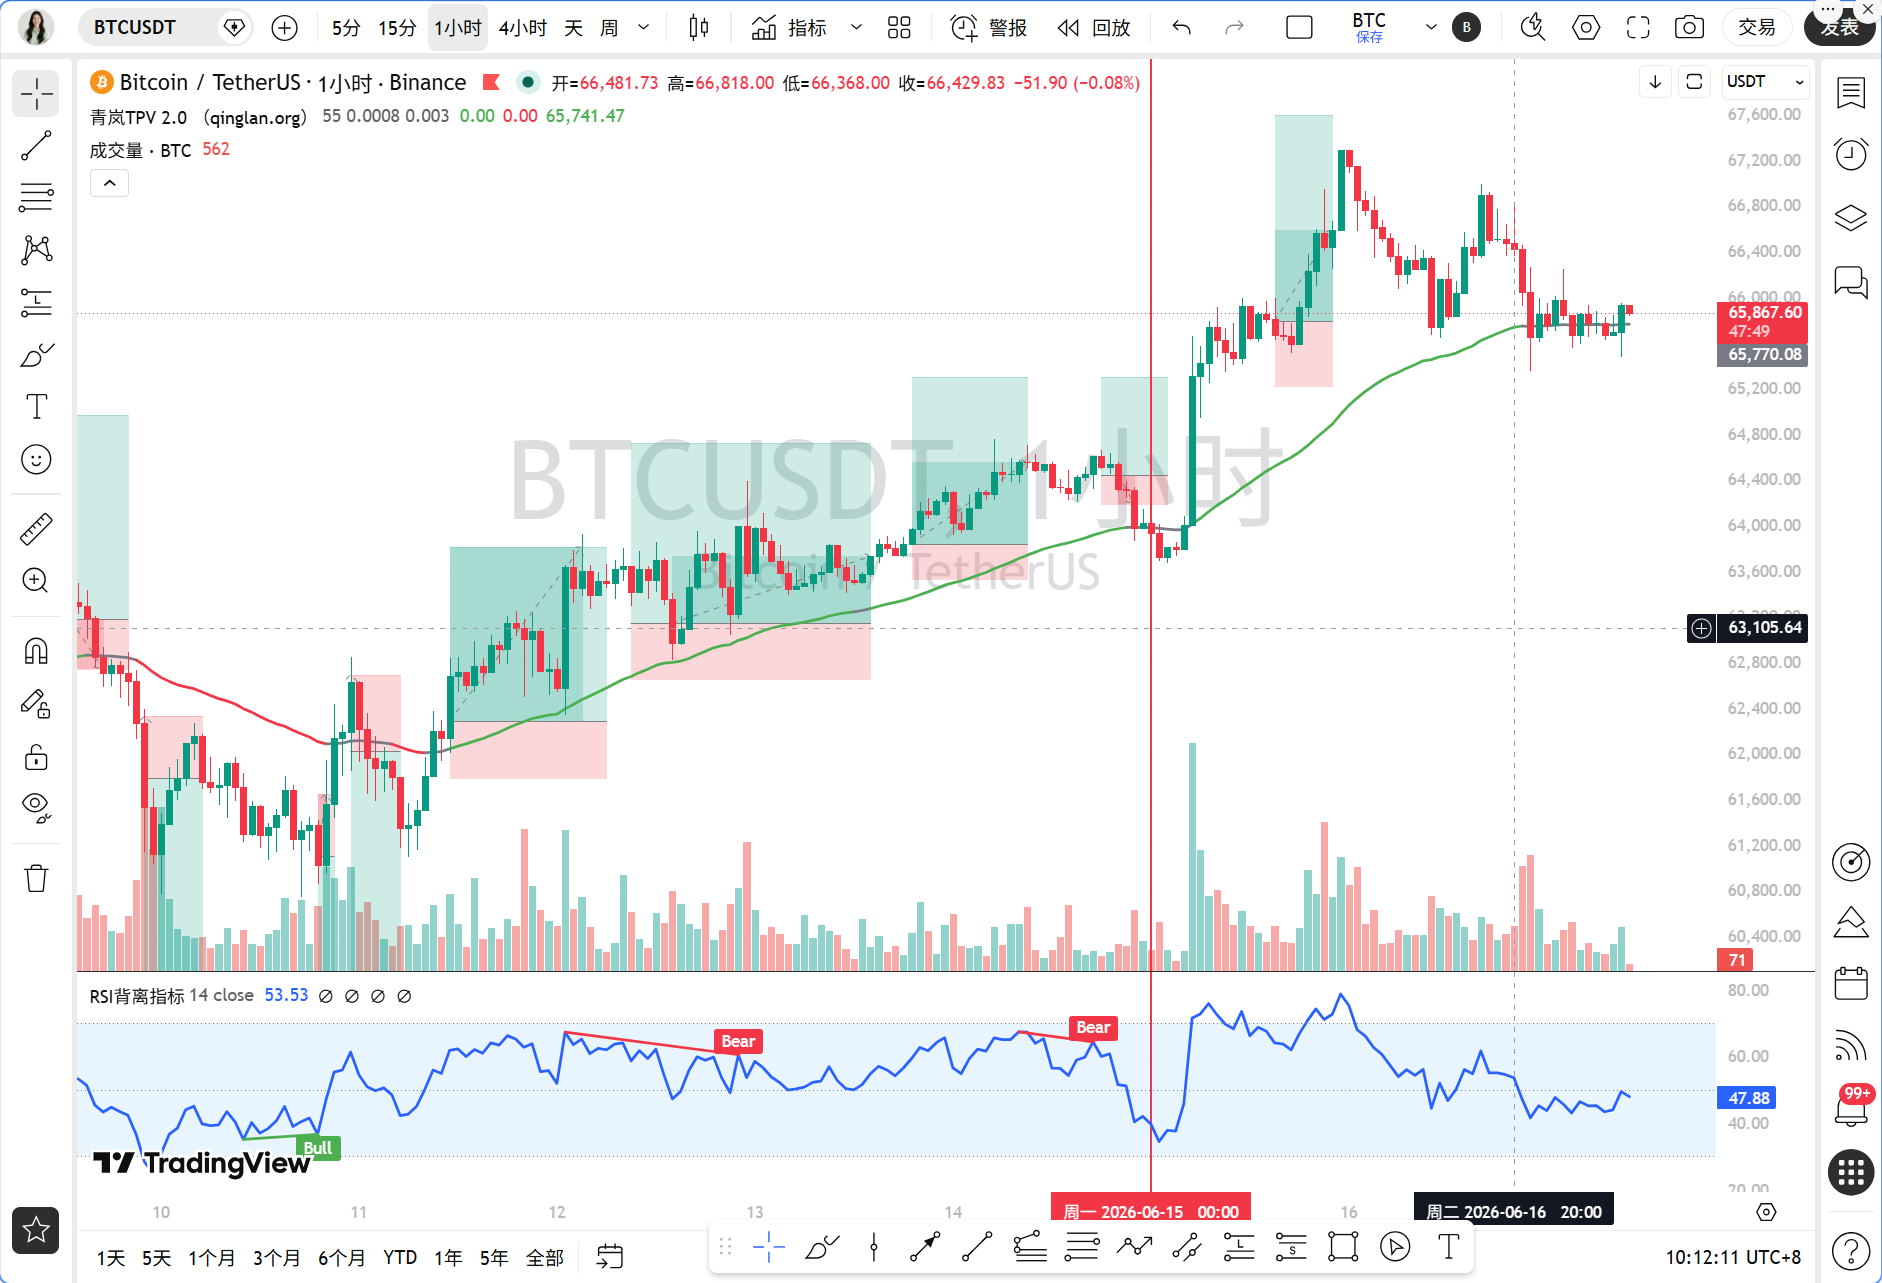
On the 1-hour level. MA5 is at 65800, MA10 is at 65813, and MA30 is at 66080. The MACD DIF is -89.58, DEA is -72.90, and the histogram is -16.68, with a death cross state, indicating that bearish momentum is continuing. The RSI is at 38.45, close to the oversold area but not yet there. The EMA55 is at 65812.57, and the current price is 65906, just slightly above EMA55.
On the 15-minute level. MA5 is at 65799, MA10 is at 65768, and MA30 is at 65763. The MACD DIF is -3.48, DEA is -27.81, and the histogram is 24.33, indicating a golden cross state, with short-term rebound signs. The RSI is at 57.62, leaning towards strong neutrality. The 15-minute chart shows a willingness for short-term stabilization and rebound.
TPV Signal Verification
Now we will use the TPV system from Qinglan Crypto Classroom for positioning. The core rule is to use the 1-hour EMA55 as the dividing line for long and short positions.
First, trend positioning. The current price is 65906, and the 1-hour EMA55 is 65812.57, with the price above EMA55, indicating a bullish trend area. But note, this position is very close, falling into a critical point.
Second, verification of long position conditions. Condition 1 is that the price stays above EMA55, requiring two consecutive 1-hour candlestick closing prices above EMA55. The last two closing prices for the most recent 1-hour candles are 65850 and 65906, both above 65812.57, so Condition 1 is met. Condition 2 is for support to stabilize, which requires a long lower shadow or bottom reversal signal. The most recent 1-hour candle has a lower shadow, but the magnitude is small, not counting as strong support. Condition 3 is for bearish momentum to exhaust, requiring the MACD histogram to shorten for two consecutive periods. The 1-hour MACD histogram has shortened from -18.23 to -16.68, thus Condition 3 is met. However, the support strength of Condition 2 is relatively weak, so the long signal is incomplete.
Third, verification of short position conditions. Condition 1 is that the price is pressured below EMA55, requiring two consecutive candlestick closing prices below EMA55. Since the current price is above EMA55, Condition 1 is not satisfied, thus the short signal is invalid.
Fourth, handling the ranging market. In the last 8 1-hour candles, the number of times the closing price exceeded EMA55 is 3, and the number of times it crossed is also 3. The current price's absolute distance from EMA55 is 0.14%, which is less than 0.3%. This fully meets the criteria for a range judgment. Therefore, the TPV system determines the current situation as a ranging market, not actively taking long or short positions, only providing a range.
On-chain Funding Situation
In terms of on-chain data, the Fear and Greed Index is 23, indicating extreme fear, which shows that retail sentiment is very pessimistic. In such times, reversals are often easy to occur. Grayscale deposited 1863 BTC into Coinbase, signaling short-term selling pressure. On the other hand, Arthur Hayes' associated addresses continue to increase their holdings in ETH, showing institutional confidence in Ethereum. The RWA tokenization scale has broken through 43 billion USD, with institutional funds continuing to flow in. Overall, on-chain sentiment is intertwined, but signs of long-term positioning by institutions are evident.
Key Attack and Defense Levels
Based on the TPV system and the multi-period structure, I provide the following key levels. The upper resistance level is above the 1-hour EMA55, around 65812, but more critically, the 4-hour MA10 is at 66237 and MA30 is at 66080. If the price can break through 66200, bulls will regain superiority. The lower support level is in the crossover area of the 1-hour MA5 and MA10, approximately 65750 to 65800, and below that is the daily MA5 at 65622. If it breaks below 65600, it may test the 4-hour MA30 at 64977.
Trading Thoughts
In a ranging market, Qinglan Crypto Classroom suggests focusing on range trading, avoiding chasing highs and selling lows.
Direction: Ranging, high sells low buys.
Entry Conditions: If the price dips to the 65600 to 65700 area and forms a bottom reversal signal or long lower shadow on the 15-minute chart, you can take a light long position. If the price rebounds to the 66200 to 66300 area and forms a top reversal signal or long upper shadow on the 15-minute chart, you can take a light short position.
Stop Loss: Set long stop loss below 65450. Set short stop loss above 66450.
Target Levels: For longs, the first target is 66000, and then 66200. For shorts, the first target is 65800, and then 65600.
If the price breaks through 66300 and stabilizes, the ranging pattern may turn bullish at that time, and you can take long positions accordingly. If the price breaks below 65450, the ranging pattern may turn bearish at that time, and you can take short positions accordingly.
Risk Warning
In a ranging market, prices may repeatedly cross key levels. Be careful to control your positions to avoid heavy bets.
Follow Qinglan Crypto Classroom, let's seize more trading opportunities together! Welcome to visit the official website www.qinglan.org
📊 Qinglan TPV Trading Strategy Backtesting Reference
🕒 Last backtesting time 06-17 07:00:02
Total analysis: 2300 Backtests: 1832 Accuracy: 70.7% (1296/1832)
免责声明:本文章仅代表作者个人观点,不代表本平台的立场和观点。本文章仅供信息分享,不构成对任何人的任何投资建议。用户与作者之间的任何争议,与本平台无关。如网页中刊载的文章或图片涉及侵权,请提供相关的权利证明和身份证明发送邮件到support@aicoin.com,本平台相关工作人员将会进行核查。


