From the daily chart, it can be clearly seen that after the price dips around 1503, it hits the bottom and begins to bounce back. The highest point of the rebound forms a resistance level at 1848, and whenever the price rises to this area, it starts to face selling pressure and falls back. From the trend line drawn in the four-hour chart, it is clearer that after the price peaks at 1848, it gradually lowers with high points descending and low points also descending, forming a standard downward channel. The lower level of 1760 is the starting platform for this round of rebound; if the entity breaks below, the space below will open up directly.
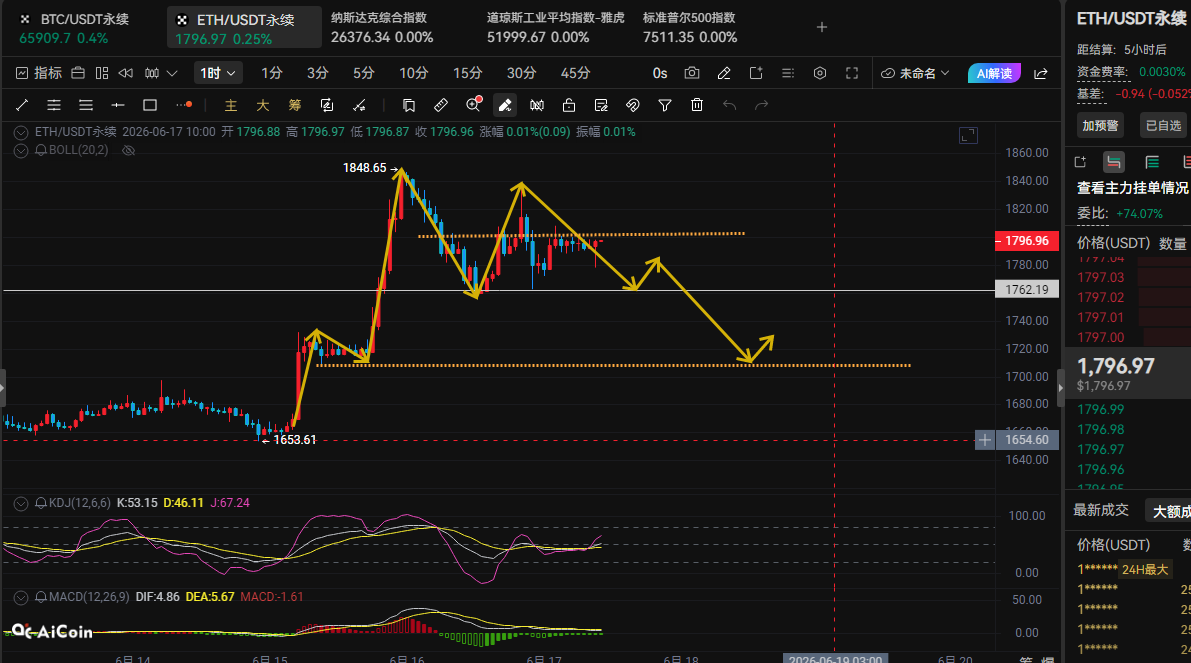
It is recommended to enter short positions around 1800-1810, with targets around 1770-1720.
Bitcoin has continuously closed with gains, but after reaching around 67000 yesterday, it is unable to continue rising, closing with a small bearish doji. Throughout the day, it maintains a narrow range of bearish downward fluctuations, with the key support level at 64500, which is also the central point of this round of upward movement. If the four-hour entity breaks below 64500, the bears will directly initiate a second phase of downward movement. At the same time, on the hourly chart, it shows a bearish downward movement, indicating that the bulls are unable to mount a counterattack. The main strategy is to short on high points.
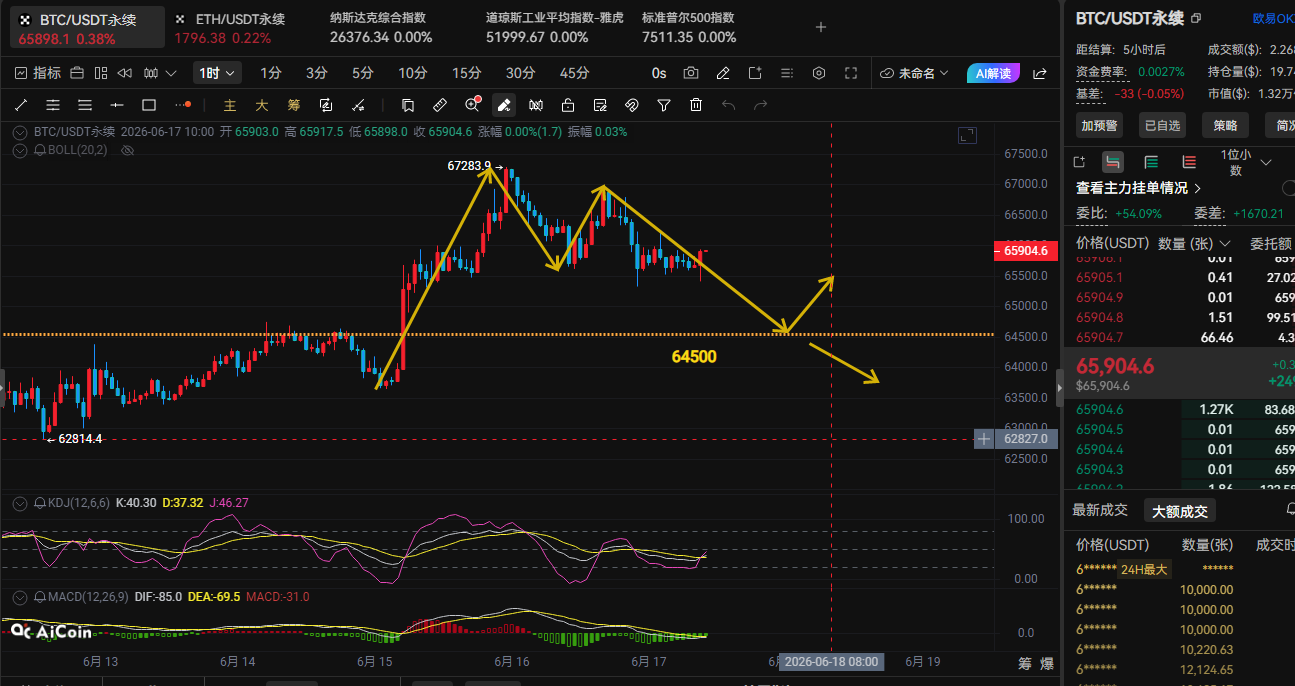
It is recommended to enter short positions around 65900-66400, with targets around 65400-64600, and below that, watch for 64500.
The market changes rapidly, and the strategy is for reference only; always set stop loss and take profit.
Search on your phone for “三条” + san2345 (Thirteen Ether).

免责声明:本文章仅代表作者个人观点,不代表本平台的立场和观点。本文章仅供信息分享,不构成对任何人的任何投资建议。用户与作者之间的任何争议,与本平台无关。如网页中刊载的文章或图片涉及侵权,请提供相关的权利证明和身份证明发送邮件到support@aicoin.com,本平台相关工作人员将会进行核查。


