Cryptocurrency Scholar: Is the Ethereum rebound on June 18 an opportunity or a trap? Latest market analysis and trading suggestions
Ethereum's current price is 1800, and many cryptocurrency friends who went south around 1700 have already adjusted their positions and exited. Listening to advice while being well-fed, the effective upward movement at 1740 is now a test that doesn't depend on technology but on mindset; the current rebound is just a low-level correction, not a bull market reversal, so whether going south or north, fast entry and exit is the way to go.
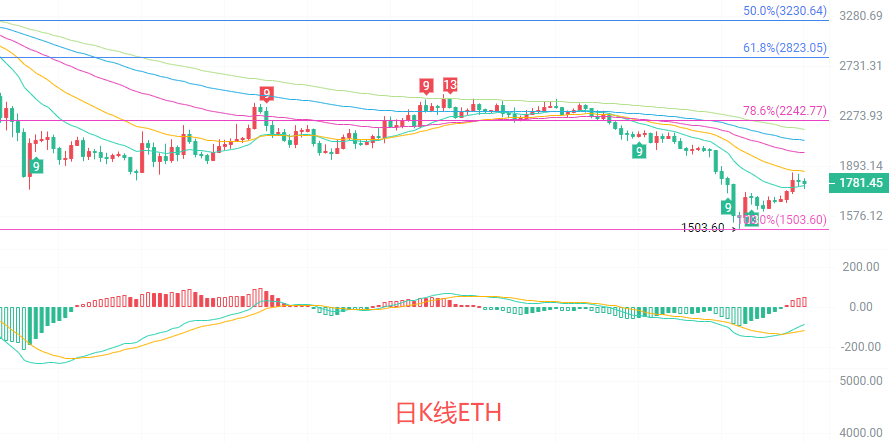
The daily candlestick price stands above the Bollinger Band's middle track near 1768, supported by the lower track at 1484, while the upper track at 2052 forms short-term pressure. The MACD's downward momentum is clearly weakening, while the upward strength begins to release. The price is currently still running below the EMA15/30/60 moving averages, and the mid-term downward trend has not yet been completely reversed, but there are signs of a halt in the decline and stabilization, which requires attention to whether it can stand firmly above the EMA15 moving average at 1760 to confirm the continuation of the rebound.
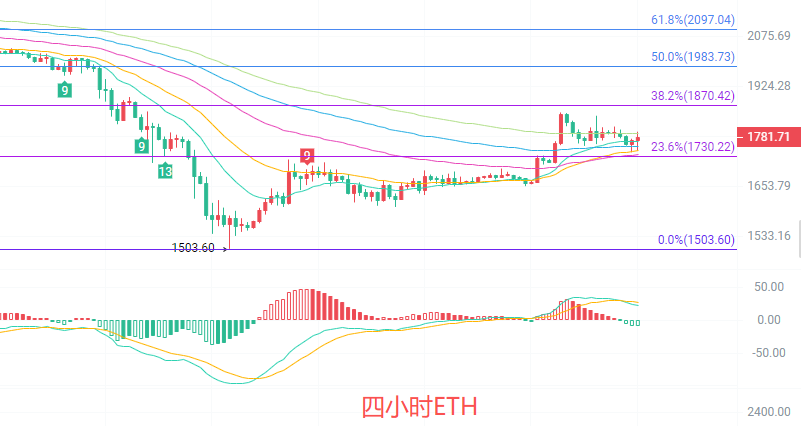
The four-hour fast line has broken through the downward trend line, standing above the EMA15/30/60/90 moving averages, forming a short-term upward arrangement. The Bollinger Band's opening is narrowing, with the price operating around the middle track at 1765; the upper track at 1856 is the short-term rebound target, and the lower track at 1674 is strong support. The MACD indicator shows upward momentum dominating. The price has broken through the Fibonacci 23.6% pressure point at 1730, with the next target at 38.2% at 1870. Currently, after consecutive rising candlesticks, there is a slight pullback, which is a normal consolidation process during a rebound and does not show clear signs of a peak.
Short-term reference:
Above 1870 to 1920 going south, stop loss at 1950, target looking at 1820 to 1780
Below 1760 to 1730 going north, stop loss at 1700, target looking at 1800 to 1850
Specific operations should focus on real-time market data. For more information, please consult the author. The article publication may be delayed; suggestions are for reference only, and risks are borne by readers.

Friendly reminder: The above content is solely created by the author on the public account, and ads in the article’s end and comment section are unrelated to the author. Please discern carefully; thank you for reading.
免责声明:本文章仅代表作者个人观点,不代表本平台的立场和观点。本文章仅供信息分享,不构成对任何人的任何投资建议。用户与作者之间的任何争议,与本平台无关。如网页中刊载的文章或图片涉及侵权,请提供相关的权利证明和身份证明发送邮件到support@aicoin.com,本平台相关工作人员将会进行核查。