Good morning, friends, I am Qinglan. The focal news from early this morning can be described as a heavyweight bomb dropping directly on the market. The Federal Reserve's hawkish signals have been fully upgraded, with Waller's hawkish debut directly igniting the market, as nearly half of the policymakers have shifted towards interest rate hikes, and the market has fully priced in a 25 basis point hike by the end of the year. Meanwhile, the Middle East conflict coupled with high inflation is putting pressure on the entire risk asset market. On the other hand, Andrew Tate faced liquidation 8 times within 16 hours, and Ma Ji's brother Huang Licheng had his ETH long position forcibly closed. Although these individual events are not large in scale, they reflect the current market's extreme volatility and high leverage risks. Against this backdrop of internal and external pressures, whether Bitcoin can hold its key support today is what we need to observe closely.
Current Price and Time
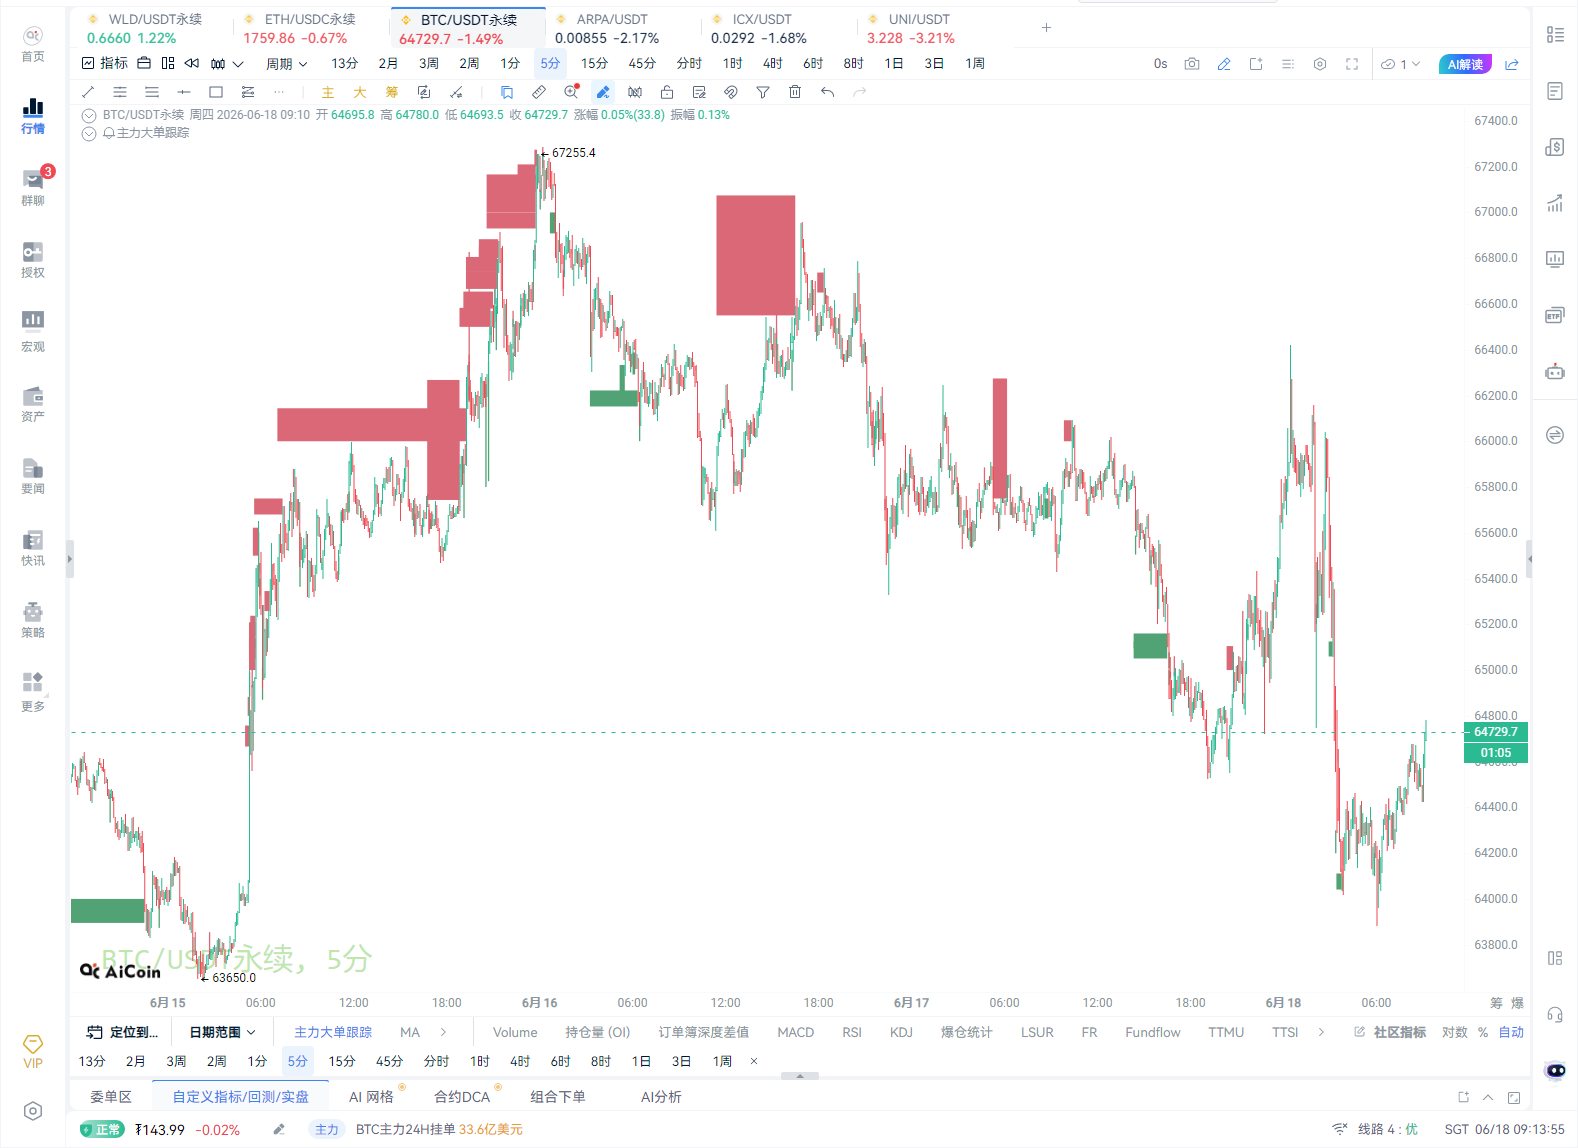
The current time is June 18, 09:50, with Bitcoin quoted at 64518 USDT. The 24-hour decline is 1.78%, and market sentiment is extremely fearful, with the Fear and Greed Index at only 22, indicating that both retail and institutional investors are seeking safety. This position is a key node resonating with both technical and news factors.
Multi-Period Status Overview
First, let's look at the daily level. The daily MA5 is at 65355, MA10 at 64168, and MA30 at 68770. The MACD's DIF is at -2311, DEA at -2902, and the histogram is positive at 591.6, indicating that although the DIF is still below the zero line, the downward momentum is diminishing. RSI is at 52.26, in a neutral to weak area. Overall, the daily trend is still bearish, but there is MA10 support around 64168 below. If it can hold here, there is a possibility of a rebound at the daily level.
At the 4-hour level, MA5 is at 64778, MA10 at 65249, and MA30 at 65251. The MACD's DIF is at 74.67, DEA at 360.35, and the histogram is -285.68, indicating that bearish momentum is still being released; however, the DIF is getting close to the zero line, suggesting a potential golden cross. RSI is at 30.59, close to the oversold area, indicating that the downside space at the 4-hour level may be limited, but confirmation signals are needed.
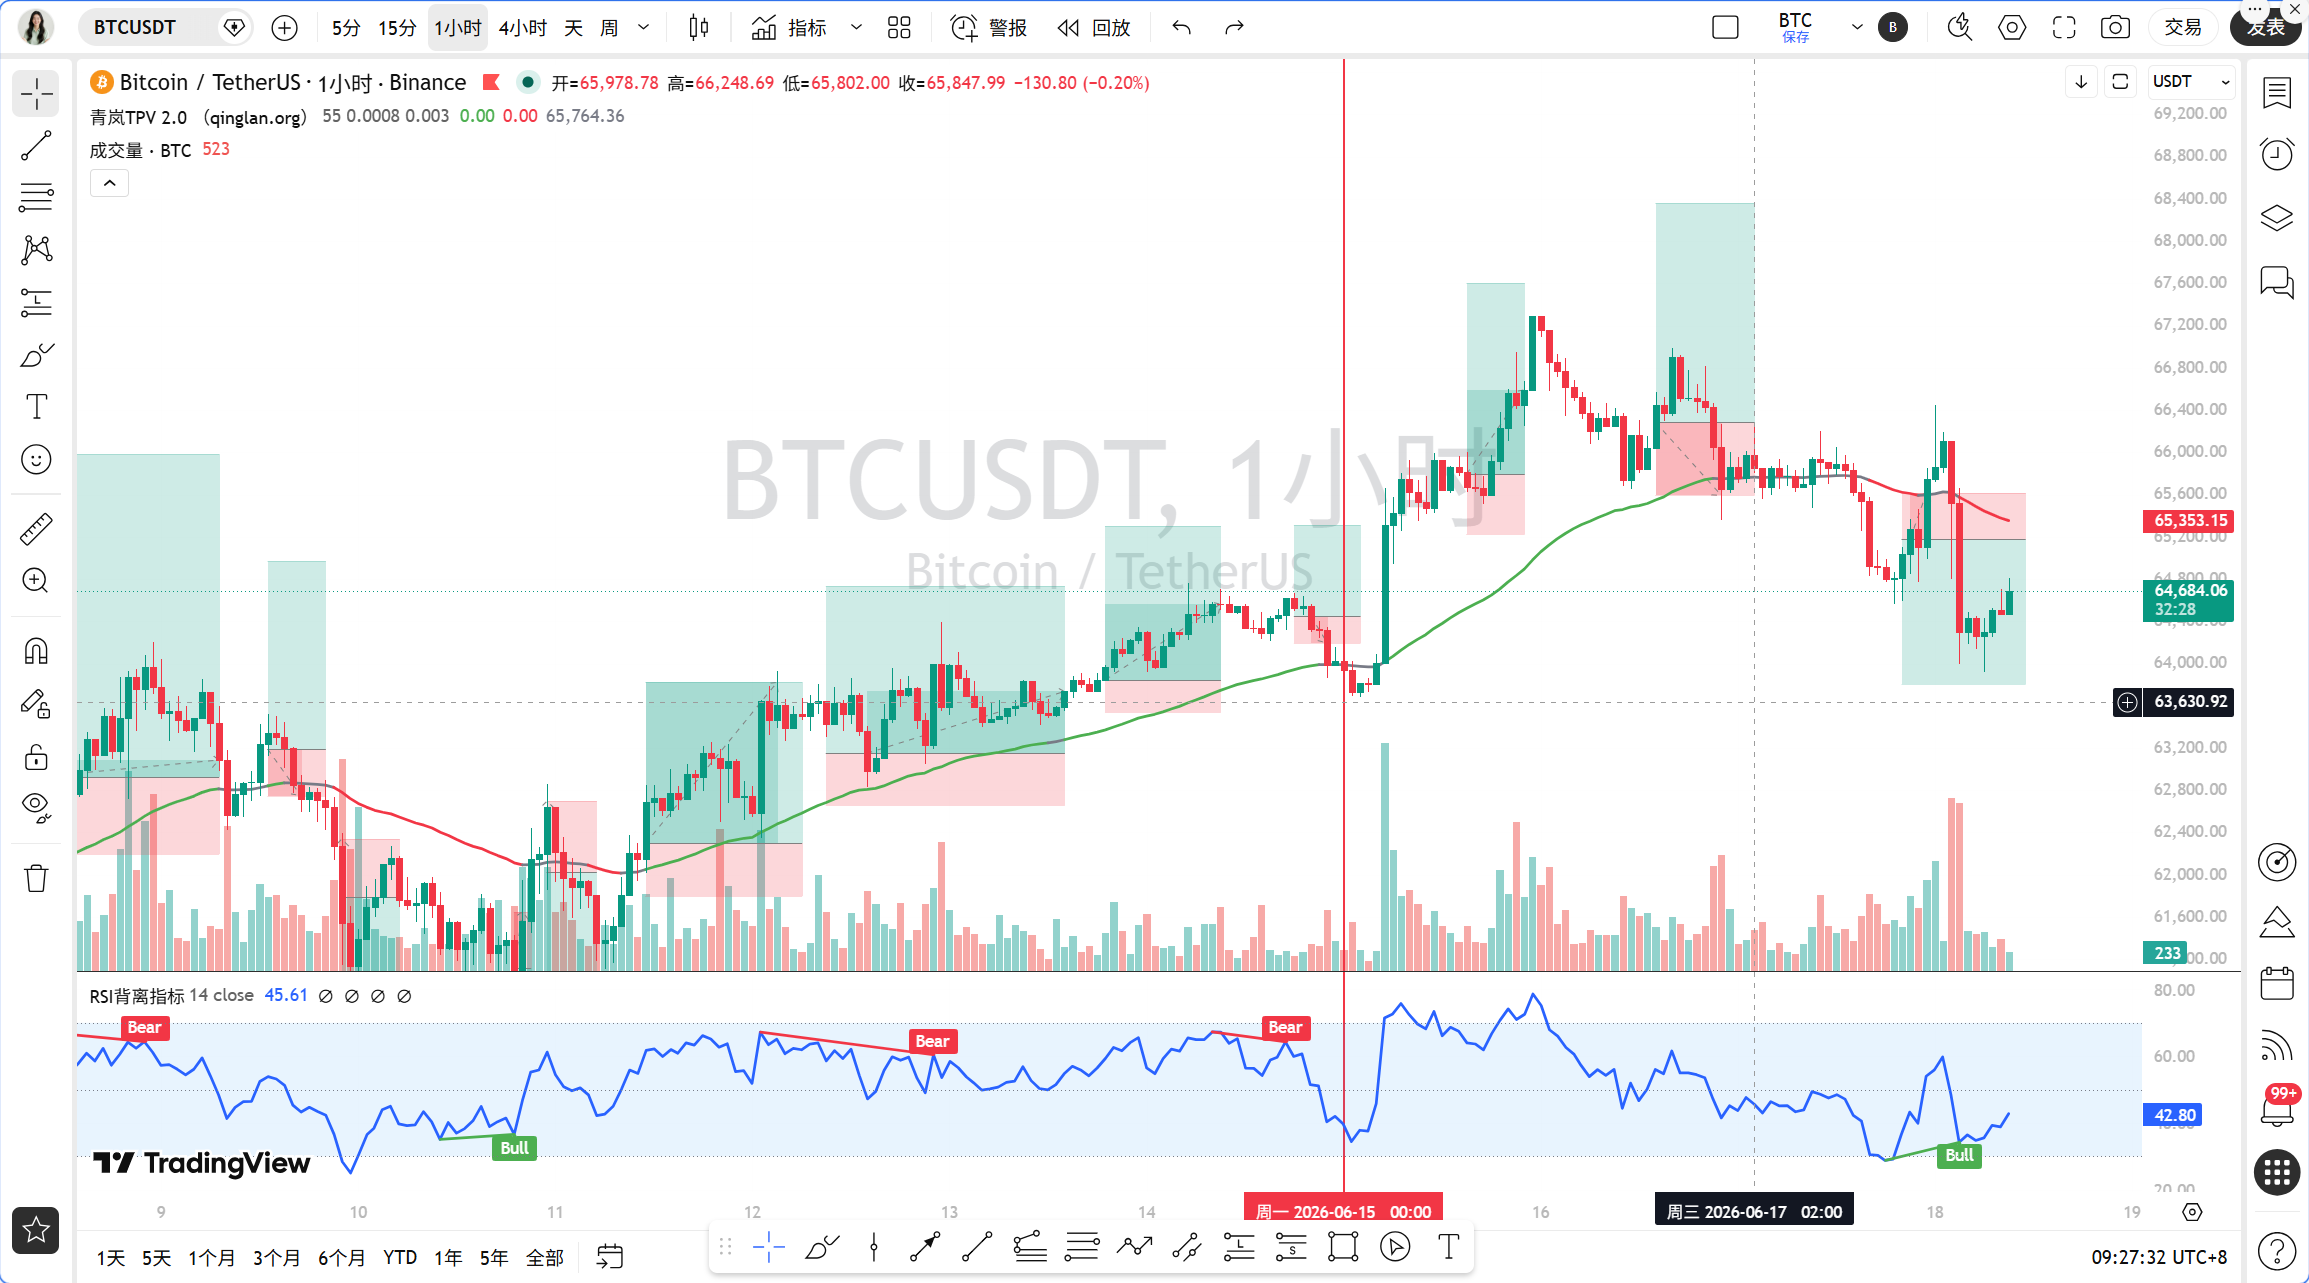
At the 1-hour level, MA5 is at 64410, MA10 at 64827, and MA30 at 65275. The MACD's DIF is at -336.71, DEA at -275.90, and the histogram is -60.81, with bearish momentum still present, but the histogram is shortening. RSI is at 46.44, in a neutral to weak position. EMA55 is at 65338, and the current price of 64518 is clearly below EMA55, indicating that the 1-hour level is in a bearish trend area.
At the 15-minute level, MA5 is at 64598, MA10 at 64576, and MA30 at 64525. The MACD's DIF is at -58.57, DEA at -114.18, and the histogram is 55.61, showing signs of a golden cross. RSI is at 56.34, returning to a neutral to strong area. The 15-minute level has short-term rebound momentum, but there is heavy pressure above.
TPV Signal Verification
According to the Qinglan TPV system, we take the 1-hour EMA55 as the boundary between long and short. The current price of 64518 is far below the EMA55 of 65338, so the trend is identified as being in a bearish trend area.
We check the short-selling conditions. First, the price is under pressure below the 1-hour EMA55. In the past 8 one-hour candlesticks, the closing prices were above EMA55 only once and crossed it once, indicating that the price has continuously operated below EMA55, meeting the conditions. Second, pressure meets resistance. From the 4-hour level, the price has encountered resistance several times in the 65200-65300 area, forming effective highs, while the one-hour level has a long upper shadow, meeting the conditions. Third, the rebound is weak. Although the 1-hour MACD histogram is shortening, the DIF and DEA are still below the zero line, with RSI at 46.44, showing no clear oversold rebound signals; overall rebound momentum is insufficient. In summary, current conditions meet the criteria for short-selling, but it is important to note that there are rebound signs at the 15-minute level, which may lead to a short-term rebound followed by a further decline.
In terms of handling the oscillating market, among the past 8 one-hour candlesticks, the number of closing prices above EMA55 is 1/8, with 1 time crossing, and the price is 1.26% away from EMA55, not meeting the oscillation threshold, indicating that we are currently in a one-sided trend, suitable for trend-following operations.
On-chain Funds Situation
In terms of on-chain data, the Fear and Greed Index is at 22, indicating extreme fear, meaning market sentiment has reached a freezing point. Bitcoin whale holdings have risen to 7.17 million BTC, a new high since March, which is a positive signal, indicating that large holders are accumulating at a low point, providing support for the price. However, on the other hand, the news of MicroStrategy selling coins to pay interest has impacted market confidence. Although there is no risk of forced liquidation with leverage, the expectation of selling coins will suppress prices. Overall, the on-chain funds situation is intertwined with both bullish and bearish signals, but the accumulation by whales is a positive signal.
Key Offensive and Defensive Levels
The first pressure level above is at 1-hour EMA55 at 65338, this is the boundary line between long and short; if the price can stabilize here, the bearish trend may turn into consolidation. The second pressure level is at 4-hour MA10 at 65249 and MA30 at 65251, this area is a dense pressure zone at the 4-hour level. The first support level below is at daily MA10 at 64168, which is the key support at the daily level; if it breaks down, we may test below the 4-hour MA5 at 64778, and even down to the 63000 area. The second support level is around the recent low from 4 hours ago, approximately in the 63500-63800 area.
Trading Ideas
Based on the above analysis, Qinglan provides the following trading ideas.
Direction: Focus on shorts, but wait for confirmation of a lack of rebound strength for entry.
Entry Conditions: If the price rebounds to the 65000-65300 area, shows a long upper shadow or top divergence, and the 1-hour MACD histogram expands again, and RSI falls back from around 50, entry for shorting can be considered. If the price directly breaks below 64168, we can pursue the short, but position control must be noted.
Stop Loss Position: After entering the short, set the stop loss above 65600, that is, 30-50 points above the 1-hour EMA55, to prevent false breakouts.
Target Position: The first target looks at 64168, and if it breaks down, the second target looks at 63500. If there are signs of support and stabilization near 64168, consider closing part of the position.
If the price unexpectedly stabilizes at 65338 and two consecutive 1-hour candlestick closing prices are above EMA55, then the short idea becomes invalid, and we will wait or try to go long with light positions.
Risk Warning
The current market is under dual pressure from the Federal Reserve's hawkish signals and geopolitical risks, and volatility may intensify; please strictly control your position, with single trade risk not exceeding 2% of total capital.
Follow Qinglan Crypto Classroom to grasp more trading opportunities! Visit our official website at www.qinglan.org
📊 Qinglan TPV Trading Strategy Backtesting Reference
🕒 Last Backtesting Time 06-18 07:00:02
Total Analysis: 2324 Backtesting: 1835 Accuracy Rate: 70.8% (1299/1835)
免责声明:本文章仅代表作者个人观点,不代表本平台的立场和观点。本文章仅供信息分享,不构成对任何人的任何投资建议。用户与作者之间的任何争议,与本平台无关。如网页中刊载的文章或图片涉及侵权,请提供相关的权利证明和身份证明发送邮件到support@aicoin.com,本平台相关工作人员将会进行核查。