After completing the weekly gap closure yesterday, the Nasdaq recorded two consecutive bearish candles, and the cryptocurrency market simultaneously entered a corrective rhythm. Recently, it has become evident that the correlation between the U.S. stock market and the cryptocurrency market has strengthened again. When the overall risk appetite for risk assets decreases, the cryptocurrency market often faces greater selling pressure.
From a cyclical structure perspective, the cryptocurrency market at the daily level has already entered a high zone. If this round of rebound cannot break through previous highs and form effective volume, it is highly probable that it will enter a topping phase. What the market currently lacks most is incremental capital, and the rebound is more about oversold repair rather than the initiation of a new bull market.
It is worth noting that Bitcoin has retraced nearly 50% from its historical high of $126,000 and has entered a typical medium-term adjustment range. Although the ETF has experienced net outflows for five consecutive weeks, the outflow speed has obviously slowed down, and some institutions have started to accumulate against the trend around the $60,000 level. This indicates that the market is gradually transitioning from panic selling to a stage of value betting.
On the macro level, as the FOMC meeting approaches, the market's divergence regarding future interest rate paths has increased, and short-term volatility may further amplify. The recent typical V-shaped reversal in the oil market followed by another drop also indicates that funds remain cautious about future economic growth expectations. Historical experience shows:
When oil prices rise, inflation heats up, and risk assets are pressured;
When oil prices drop, liquidity expectations improve, and risk assets benefit.
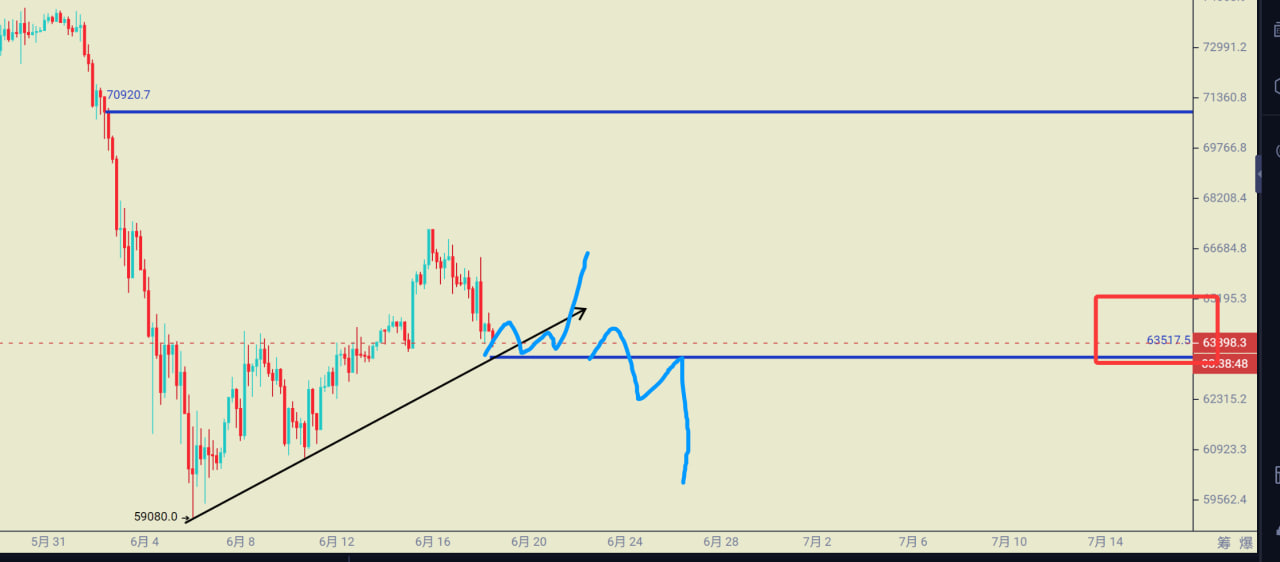
From a technical perspective, Bitcoin has formed a relatively obvious step-like decline structure in the short cycle. Although the 1-hour, 2-hour, and 4-hour cycles are gradually approaching the oversold area, indicating a demand for technical rebound, the 8-hour and 12-hour cycles still maintain a bearish trend, and the daily chart is starting to show topping characteristics.
Currently, the area of $64,700—$65,000 coincides significantly with the key Fibonacci retracement levels and Elliott wave correction ranges, making it a very important battleground for bulls and bears. If the rebound cannot effectively stabilize above this area, the market will continue to maintain a bearish pattern in high-level oscillations.
Overall:
The overall direction remains bearish, and the main strategy is to sell on rallies;
Buying at low levels is only for short-term auxiliary trading;
Before there is a unified resonance in the larger cycle, the market will continue to maintain wide oscillations.
Tencent Meeting 24-hour live room: 759-223-4196

This article is published by 【Huiying Community】 and represents only personal views. Due to a certain delay in information transmission, the content is for reference only and does not constitute any investment advice. Please judge rationally and operate cautiously.
If you need to obtain more timely daily market analysis and strategic ideas, you are welcome to add Safew's contact information, or add three lines: MY89080, to join the group for free learning.
Our community has 15 professional analysts monitoring the market live all day. Here, you can learn technical analysis methods in practical situations and also systematically understand the ideas for unlocking positions and the risk control system.
免责声明:本文章仅代表作者个人观点,不代表本平台的立场和观点。本文章仅供信息分享,不构成对任何人的任何投资建议。用户与作者之间的任何争议,与本平台无关。如网页中刊载的文章或图片涉及侵权,请提供相关的权利证明和身份证明发送邮件到support@aicoin.com,本平台相关工作人员将会进行核查。