Recently, HYPE has been rising quite rapidly, right? Our platform actually noticed Hive early on; I wrote an analytical article about it in February when it was just over twenty dollars. Who would have thought it would surge to over seventy now? If anyone is interested, you can search for Hive on the official AiCoin site, where you can find our in-depth analysis that discusses its ten core logic points behind the rise—such as its high performance public chain that truly moves the settlement on-chain, and it has also exploited the KYC loophole for Europe and America. Many centralized exchanges do not offer contract leverage to users from Europe and America, but Hive, as a decentralized exchange that does not require KYC, has attracted a large number of users from these regions. However, this is just sharing and does not constitute investment advice; everyone should view it rationally. For the convenience of reading, this article does not include a lot of code; those who want detailed core code and teaching materials are welcome to join the group; I'll provide the method to join at the end!
Let’s get into today’s main topic. In the last lesson, we talked about the advanced version of the dual-condition indicator: triggering when the price crosses above the 20-day moving average, and filtering when the price is above the 60-day moving average; only when both conditions are met does it remind you. Many friends said it was useful, but they also reported two very practical issues: first, it’s easy to chase high prices without knowing if the crossover occurred after a healthy pullback; second, there's only an entry reminder, and if the price falls back after that, it’s uncertain whether the signal is invalid, leaving them unsure. So today, we won’t stack scattered new knowledge points, but rather we’ll refine the indicator around one need: when the major trend is still there, wait for the price to pull back and then re-establish above the 20-day moving average before reminding; if the pullback is too weak, lacking volume, or the market is too hot, then do not trigger a reminder yet; if the price falls back afterwards, it should also automatically indicate that the signal is invalid. Today's core objective is not to write a bunch of complex code, but to teach everyone how to turn an “indicator that only provides pop-up reminders” into a complete trading rule that can be reviewed and validated. As always, all content is indicator teaching and does not constitute investment advice; any rules do not imply a promise of profit.
Today, we're going to dig into this one indicator, step by step towards perfection, with a slightly higher difficulty level, so feel free to drop questions in the chat if you don’t understand something.
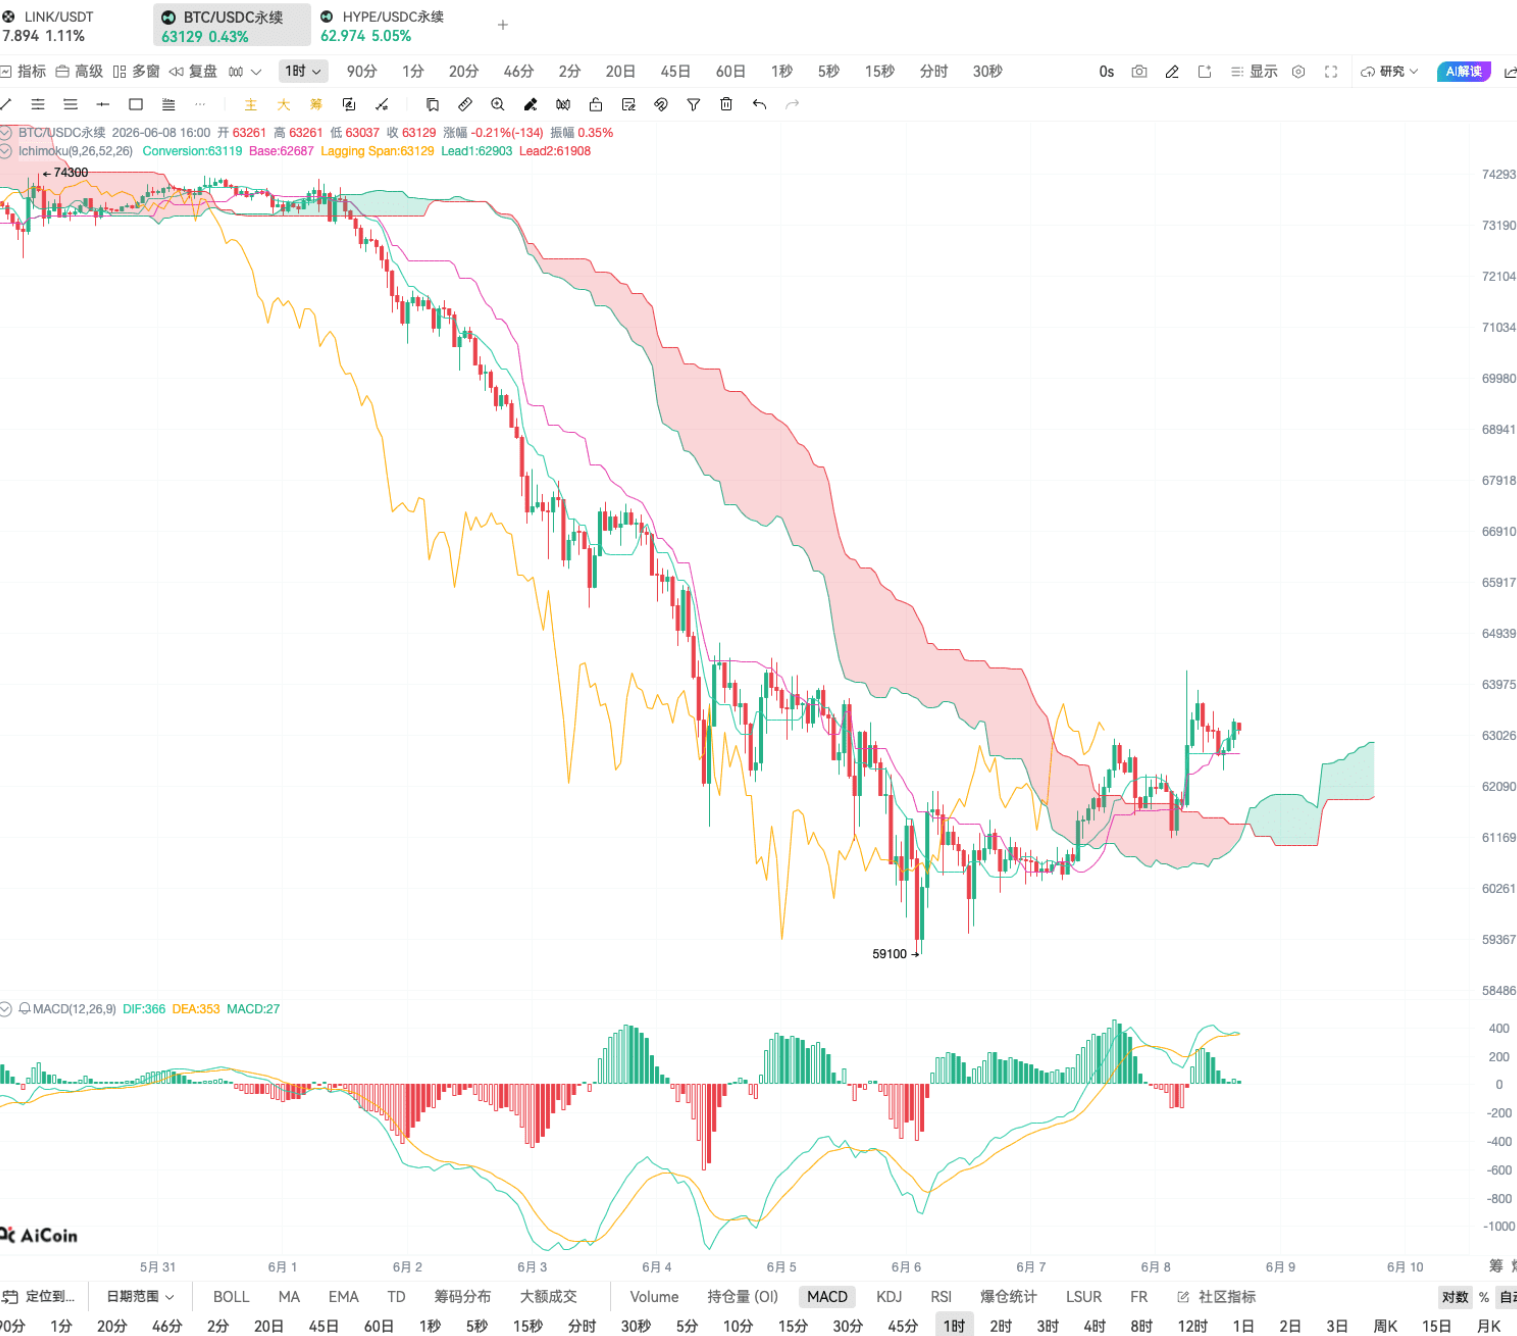
Let’s first establish the most basic framework—drawing the two moving averages. We’ll take it step by step; there’s no rush to write the signal logic, let’s first draw the basic moving averages on the K-line so that we have a reference. The operation is very simple: calculate the MA20 and MA60 moving averages using the closing prices, then use the plotting function to display them. As you can see, I’ve switched to the AiCoin editor, wrote the code and saved it, and immediately there are two lines on the K-line, with the MA20 being more sensitive to fluctuations and the MA60 showing a smoother trend.

Determine the major direction: only look for opportunities above the 60-day moving average. For trend judgment, we won't complicate it; we'll use the simplest and most effective standard: if the closing price is greater than MA60, we consider that the major trend is still in an upward range. This doesn’t mean that meeting this condition guarantees a rise, but only when the direction is correct does our pullback and long logic have observational significance. If the price even breaks below the 60-day line, thinking about catching a bottom on a pullback would be going against the trend, which likely results in losses.
Write the core logic: must break below then reestablish before it counts as a qualified pullback. Many people write pullback signals and rush to remind when they see the price cross above the 20-day line; that’s not a pullback at all, it’s just a simple breakout and can easily lead to being caught at short-term highs. A real pullback must have a complete action of drop and rise: the closing price of the last K-line must break below the 20-day moving average, but not break the major support at the 60-day line; only when the current K-line re-crosses above the 20-day moving average is the pullback confirmation considered complete.
Add two layers of filtering: filter out poor quality signals to improve win rate. A basic pullback reestablishing pattern is not sufficient; many weak rebounds can also produce this appearance, and carelessly entering can easily lead to being stuck. Therefore, we’ll add two layers of filtering to directly screen out the signals of low quality.
The first layer is RSI Heat Filtering. Everyone is familiar with RSI, which uses values from 0 to 100 to reflect market strength. We’ll set a comfortable range: if the RSI is below 50, it indicates that the short-term trend is too weak, and even if there is a pullback reestablishing, don’t rush to enter; if the RSI is between 50 and 75, it is in a slightly strong but not overheating state, which is the most suitable signal range; if the RSI exceeds 75, it indicates that the short-term has already overheated, and it’s easy to jump in at the peak. Remember, RSI here is not an independent trading signal; it only serves as a “quality certification” for the pullback signal.
The second layer is Volume Filtering. The reestablishing after a pullback requires genuine capital recognition to count. We add a requirement: the day’s trading volume must be higher than the average of the past 20 days, indicating that this reestablishment is driven by capital entering the market, not a false breakout created by scattered retail buying. Adding these two layers of filtering will make the number of signals significantly decrease, but the remaining ones will have much higher accuracy. Adding these two conditions into the code and running it makes the signals sparser. Many of the previously weak rebound signals have been filtered out, leaving only quality opportunities where trends, volume, and heat are all in place. By now, we have stacked five conditions: trend, pullback, reestablishing, RSI filtering, and volume filtering. The more conditions added, the fewer signals that meet the requirements, but the quality of each will be higher. Remember when writing indicators: adding conditions should not be arbitrary; you should reflect on what problem each one solves.
补失效规则:know when to exit. Indicators that only write entry signals can only be considered semi-finished products. We must also clarify the invalidation conditions to tell us when the signal is void and needs to exit. Two situations count as signal invalidation, and meeting any one of them triggers a reminder: first, the price re-breaks the 20-day moving average, indicating that the short-term pullback rebound logic has failed, and the rhythm is already off; second, the price directly breaks below the 60-day moving average, meaning the major trend is broken, making the prior long logic naturally untenable. With both entry and invalidation rules in place, we can add the trading function and formally conduct backtesting. Entry occurs only when all five conditions are met, and exit occurs when invalidation conditions are triggered. You can also adjust the strictness of invalidation according to your trading style; for example, if you only consider breaking the 20-day line as invalid, the tolerance will be higher.
Run backtest to validate: don’t just implement it directly into live trading. Once the complete buying and selling rules are in place, it’s crucial to run a backtest to see the actual results. Backtesting is not used to predict how much you can earn in the future, but to help you check: Did your rules execute as expected? Are there enough signals for trading? Is the failure rate too high? Can you handle the maximum drawdown? If you switch to a different asset or a different timeframe, does the logic still hold? For instance, this indicator used on Hive yielded a total of 5 trades, 4 losses and 1 win, with a return of only over 20%, which is quite mediocre; but when applied to BTC, the return can reach 100%, with over 20 trades. Try it on a 4-hour timeframe, and the results will differ again. Therefore, there is never a universal indicator, only rules suited for specific assets and specific timeframes. After writing your indicators, make sure to backtest them more and try various assets; don’t just rush to use them live immediately.
Using Signal Probes: give the indicator a comprehensive check-up. Many friends, after writing their indicators, find that signals don’t come out for a long time and think there’s an error in the code. It may not be the case; it’s likely that some sub-condition was not satisfied. We can plot each sub-condition separately using a plotting function, effectively giving the indicator a check-up: Is the trend qualified? Has there been a pullback? Does the RSI meet the standard? Is the volume sufficient? It can be clearly seen at a glance.
Interestingly, many people writing this type of indicator easily fall into five pitfalls: first, only focusing on the 60-day line being above to go long, which has too few conditions, making signals unusable; second, not waiting for pullback confirmation and jumping in as soon as the price crosses the 20-day line, resulting in being caught at the high; third, adding RSI and volume but not understanding why they’re added, parameters are set randomly; fourth, having only entry reminders without invalidation and exit rules, causing profits to be unrecoverable and losses to be held on to; fifth, not breaking down and investigating when there are no signals, not knowing where the problem lies. The bottom line is: for every added condition, you should be able to explain what problem it solves. Arbitrarily adding conditions will only make indicators bulkier and more difficult to use.
Finally, I’ll summarize today’s core thread; you don’t need to remember complex code, just remember this logical chain: First, draw the basic moving averages MA20 and MA60; only observe pullback opportunities above the 60-day moving average to ensure the major direction is not deviating; wait for the price to break below the 20-day line, then reestablish above it to trigger an entry signal; use RSI and volume for double filtering, to screen out weak rebounds and overheated false signals; clearly write out the invalidation conditions, reminding to exit if breaking below the 20 or 60-day lines; finally use signal probes to investigate problems and backtesting to validate the effectiveness of rules. Today’s advanced class is not teaching you a bunch of flashy functions but rather refining a simple reminder indicator from “useable” to “highly usable,” assembling a complete small trading system.
After class, you can follow this line of thought to adjust parameters based on your trading habits—for example, if you think MA20 is too sensitive, you can switch it to MA30; if you feel that altcoins perform smoother with EMA, changing to EMA is also fine, the core is that the logic is coherent and fits your trading rhythm.
The lecture notes and complete code will be posted in the live Q&A group. There are two groups you can join, one is the TG live group, and the other is the AiCoin internal group; I've posted the links on the screen, and you can join whichever you prefer.
TG: https://t.me/+DWQDvFSutJs5ZjU1
Internal group: https://www.aicoin.com/link/chat?cid=enjLWN3pz
免责声明:本文章仅代表作者个人观点,不代表本平台的立场和观点。本文章仅供信息分享,不构成对任何人的任何投资建议。用户与作者之间的任何争议,与本平台无关。如网页中刊载的文章或图片涉及侵权,请提供相关的权利证明和身份证明发送邮件到support@aicoin.com,本平台相关工作人员将会进行核查。