Crypto Circle Scholar: On June 20, the battle between bulls and bears in Ethereum has intensified, how should you respond with your position? Latest market analysis and operation suggestions
Ethereum is currently priced at 1700. The current market is not friendly for speculators, don’t assume things. The original plan was to reach 1650, but the upward trend did not materialize, so like everyone else, I am holding cash. At this moment, we cannot be anxious; being too eager to make money and too keen to catch a reversal may lead to being harvested by the market instead. It is now understood that before the trend reverses, the old rule applies: primarily sell high.
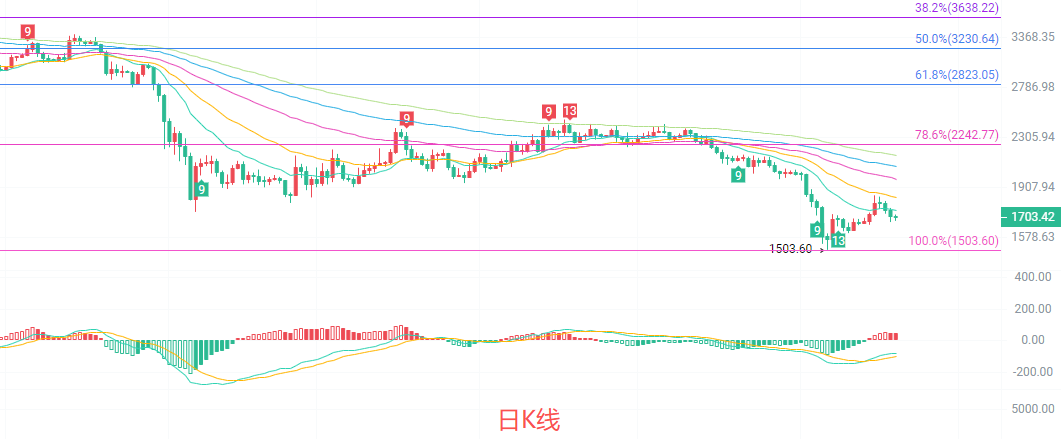
The daily candlestick chart is still in a clear downward trend, with prices operating below the EMA moving average system. The moving average cluster in the range of 1746-1837 constitutes strong resistance, with multiple rebounds failing to break through. The previous low of 1503 is the current key support. The MACD indicator shows that the DIF is still below the DEA; although the downward momentum has weakened, it has not fully reversed. The middle track of the Bollinger Bands continues to move downwards, with prices operating below the middle track, indicating an overall bearish trend. In the short term, only weak rebound signals have emerged, and there is no clear trend reversal pattern formed, so operations should be cautious.
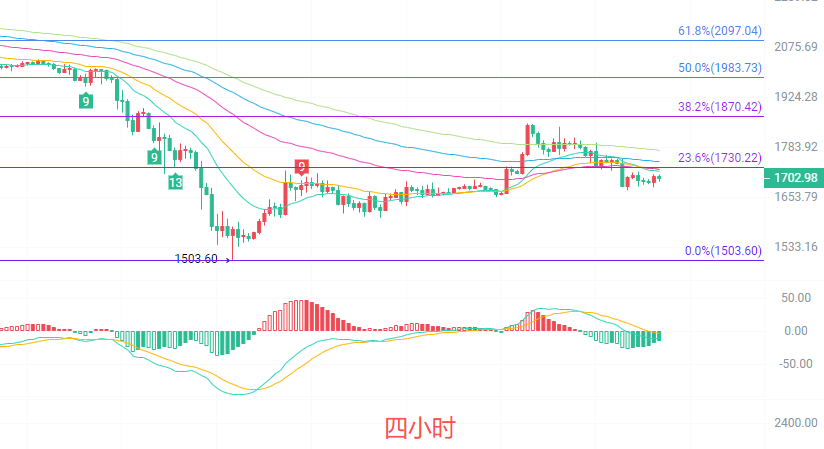
The four-hour candlestick chart indicates that after bouncing from 1503, it is currently in a consolidation phase. The current price near 1703 is under pressure from the EMA15 and EMA30 moving averages, with the Bollinger Bands tightening, and prices operating below the middle track, narrowing the fluctuation range. The MACD indicator shows that the red bars have disappeared and the green bars have reappeared, with short-term downward momentum slightly recovering. The 23.6% Fibonacci level near 1730 is a strong short-term resistance, and the support is around 1664. It is highly likely that it will maintain range oscillation in the short term, waiting for a directional choice, with no clear unilateral signals yet.
Short-term reference:
Sell from 1730 to 1760, stop loss at 1790, target of 1700 to 1650
Buy from 1650 to 1620, stop loss at 1590, target of 1700 to 1750
Specific operations should be based on real-time market data. For more information, you can consult the author. The article is published with a delay; suggestions are for reference only, and risks are borne by the reader.

Warm reminder: The above content is solely created by the author of the public account. The advertisements at the end of the article and in the comments section are unrelated to the author. Please discern carefully, and thank you for reading.
免责声明:本文章仅代表作者个人观点,不代表本平台的立场和观点。本文章仅供信息分享,不构成对任何人的任何投资建议。用户与作者之间的任何争议,与本平台无关。如网页中刊载的文章或图片涉及侵权,请提供相关的权利证明和身份证明发送邮件到support@aicoin.com,本平台相关工作人员将会进行核查。