Cryptocurrency Expert: On June 20, Bitcoin fluctuates between the range of 63,000, daily and four-hour charts reveal future market direction! Latest market analysis and trading suggestions
The current price of Bitcoin is 63,000. The essence of trading ultimately returns to life. Many cryptocurrency friends have been asking whether the market will go south or north in the past two days. If I could predict accurately, I would have been financially free by now. To put it plainly, this market is about the main players harvesting the emotions of retail investors. Whenever you buy, it drops; whenever you sell, it rises. It’s not that you’re unlucky; you just happened to step on someone else's rhythm. Instead of anxiously staring at the market every day, it's better to do what you should be doing, keep your position light, and not put your entire life into it. It’s important to spend quality time with family during the holidays.
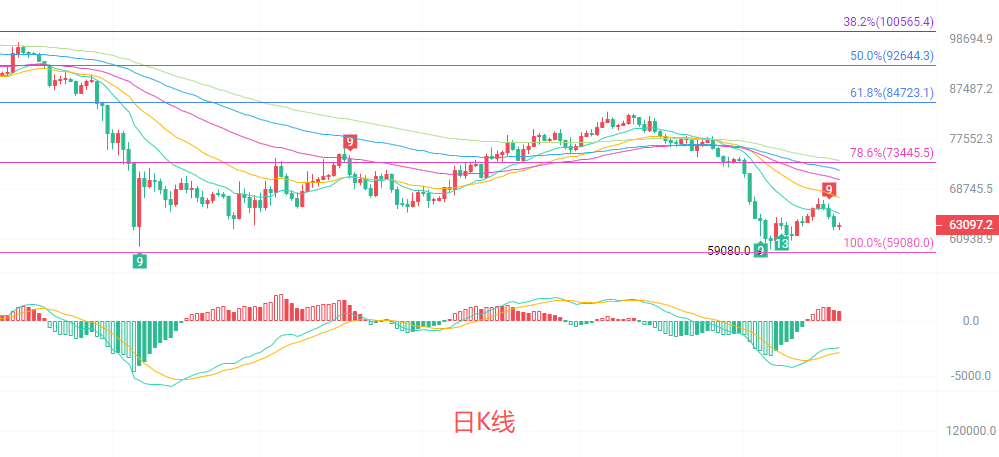
The daily candlestick chart is in a weak rebound phase after a prior decline. The price stabilizes above the 100% Fibonacci support level of 59,080, pressured by the 78.6% resistance level of 73,445. In the short term, it remains below all EMA moving averages, and the downward trend has not fundamentally reversed. The MACD indicator’s DIF and DEA stay below the zero axis, the green bars have shrunk but have not formed an effective golden cross, indicating insufficient rebound momentum. The Bollinger Bands are opening downwards, and the price is running near the lower band, with the middle band around 67,000 constituting strong resistance. Overall, it is in a weak consolidation zone after a decline, with no clear reversal signal yet.
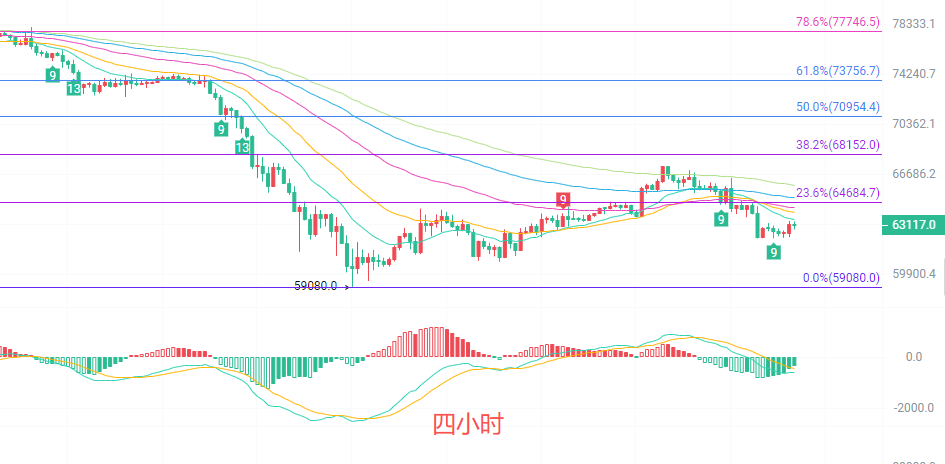
The four-hour candlestick chart shows a slight rebound after touching the low point of 59,080, currently pressured by the 23.6% Fibonacci resistance level of 64,684, failing to break through the 64,000 mark. The EMA15 and EMA30 moving averages have formed a death cross downwards, with the price breaking below short-term moving average support, and the rebound momentum gradually weakening. The MACD indicator’s DIF and DEA, after forming a death cross below the zero axis, again move downwards, with green bars increasing, indicating enhanced downward strength. The Bollinger Bands are in a contracting state, with the price breaking below the middle band, and the lower band support around 61,680. In the short term, it will likely maintain a fluctuation range between 61,680 and 64,680; breaking below the lower band will initiate a second bottom exploration.
Short-term trading idea reference: Follow the main trend of the big cycle, use small stop losses for quick entry and exit.
From below 61,500 to 62,000, target upwards; stop loss at 61,000, target looking at 63,000 to 64,000.
From above 64,500 to 65,000, target downwards; stop loss at 65,500, target looking at 63,500 to 62,500.
Specific operations depend mainly on real-time market data; for more detailed information, you can consult the author. The release of the article may be delayed; suggestions are for reference only, risks are borne by yourself.

Friendly reminder: The above content is solely created by the author of the public account. The advertisements at the end of the article and in the comments section are unrelated to the author. Please be careful in discerning them. Thank you for reading.
免责声明:本文章仅代表作者个人观点,不代表本平台的立场和观点。本文章仅供信息分享,不构成对任何人的任何投资建议。用户与作者之间的任何争议,与本平台无关。如网页中刊载的文章或图片涉及侵权,请提供相关的权利证明和身份证明发送邮件到support@aicoin.com,本平台相关工作人员将会进行核查。