Author: Darko, IOSG
The inflow of funds into ETFs is often seen as a "thermometer" of institutional confidence in Bitcoin. However, week after week, it measures something else: a hidden interest rate trade that is repeatedly switched on and off. This article clarifies how to distinguish it, how large this trade really is, and why it is quietly exiting the scene.
TL;DR
From a weekly perspective, ETF fund flows are mainly driven by a hidden arbitrage trade, not belief. Cash-and-carry traders buy ETFs while shorting futures on the CME to hedge price risk, but the data does not distinguish them from actual believers. About half of the weekly fluctuations can be explained by the new short positions added by hedge funds, with a correlation as high as 0.70.
The weekly price movements of Bitcoin hardly explain the fund flows. Using price returns to predict ETF fund flows yields results statistically indistinguishable from zero. The flows each week are not chasing price performance, but rather moving in sync with a hedged interest rate trade.
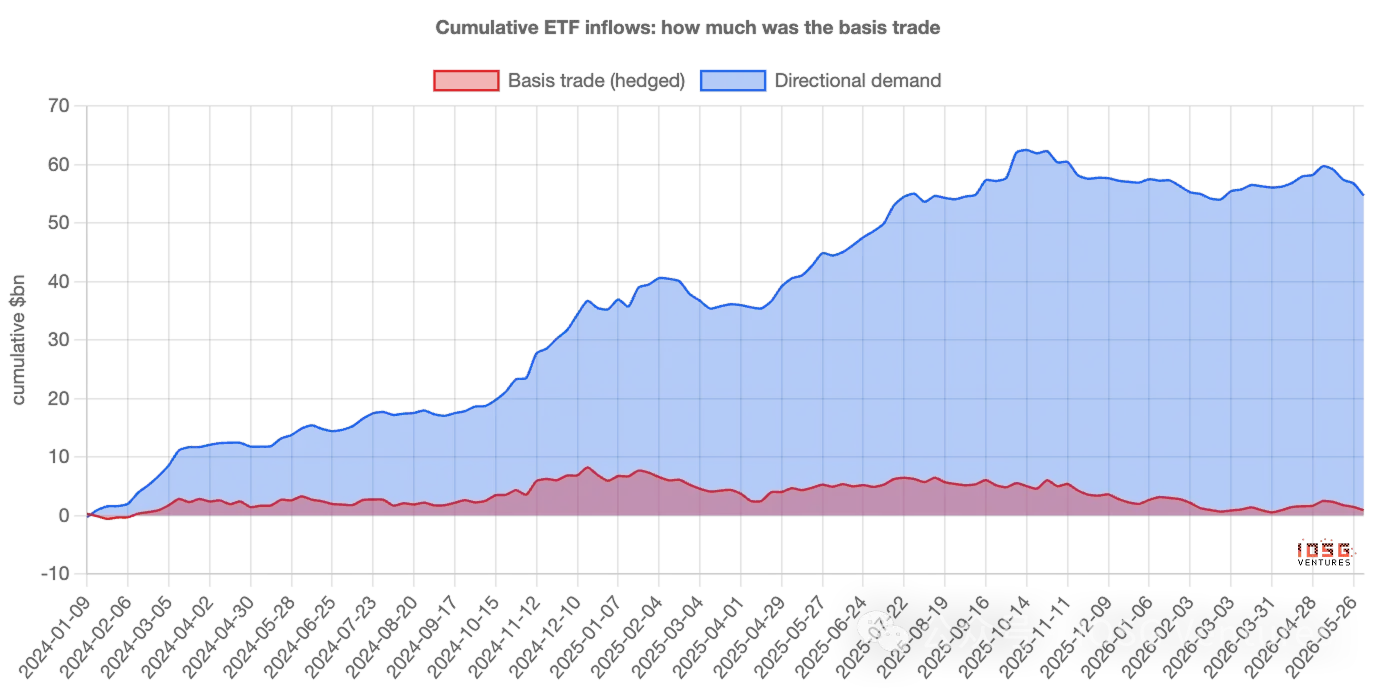
Arbitrage dominates the weekly "volatility," but never the "stock" aspect. Of the approximately $55 billion accumulated inflow into ETFs, the net amount from arbitrage trades currently only accounts for around $1 billion; the rest is stable directional buying, about $400 million per week, which compounds to nearly the entirety of the "mountain" over two years.
The correct statement is that ETF fund flows overestimate the "volatility" of belief, not its "level." The weekly ups and downs are largely "rented"—arbitrage capital comes and goes; whereas the assets that truly settle down are mostly "owned."
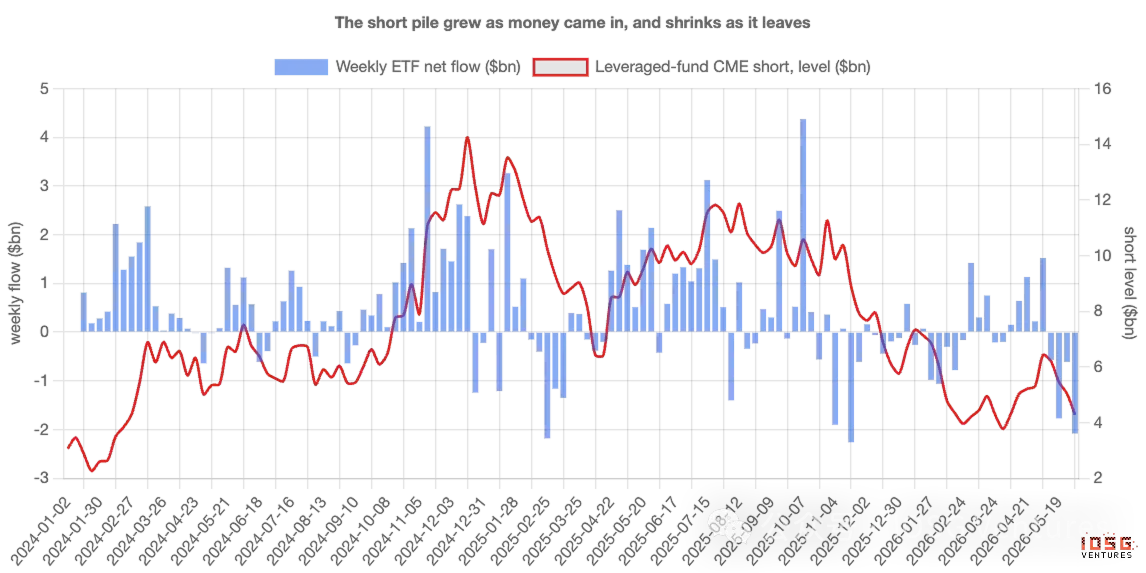
This trade is exiting, and it has been ongoing for two years. Short positions of leveraged funds have increased from about $3 billion at issuance to nearly $14 billion by the end of 2024, then gradually fell to about $4.5 billion. Once the basis compresses to unprofitable levels, inflows and shorts will retreat simultaneously—do not misinterpret the resultant outflows as a market judgment against Bitcoin.
I. The Number Everyone is Watching
Every week, Bitcoin ETFs announce the amount of funds flowing in or out, and this figure is often treated as a judgment. Large inflows signify institutional interest; outflows indicate wavering confidence. Fund flow data has quietly become a headline indicator for measuring belief in the market.
The problem is that not everyone buying ETFs is betting on Bitcoin. Some of the largest buyers do not care at all where the price goes—once they are accounted for, the weekly fund flow figures reflect more of their activity than anyone's conviction. To understand why, you need to recognize a distinctly different category of buyers.
A Type of Buyer Unconcerned with Price
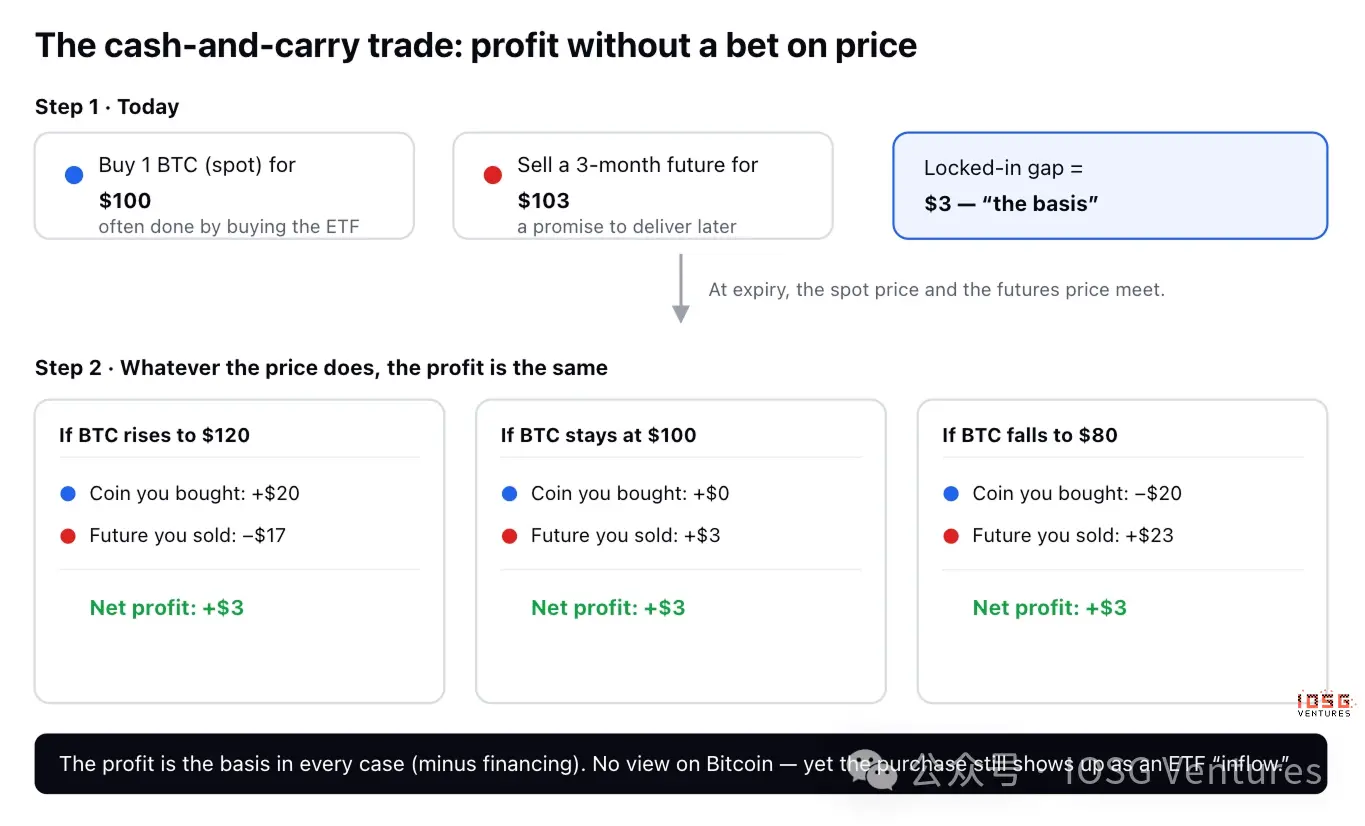
There is a classic and mundane trading strategy called cash-and-carry arbitrage. Bitcoin "futures" are just contracts to buy or sell Bitcoin at an agreed price on a future date, and most of the time, future prices are slightly higher than the current spot price—for example, Bitcoin might be $100 now, but a contract expiring in three months sells for $103.
Traders can hold no opinion on the price and simply pocket the $3 difference:
Buy 1 Bitcoin today for $100 (often realized through buying an ETF).
Sell futures at $103, promising delivery in three months.
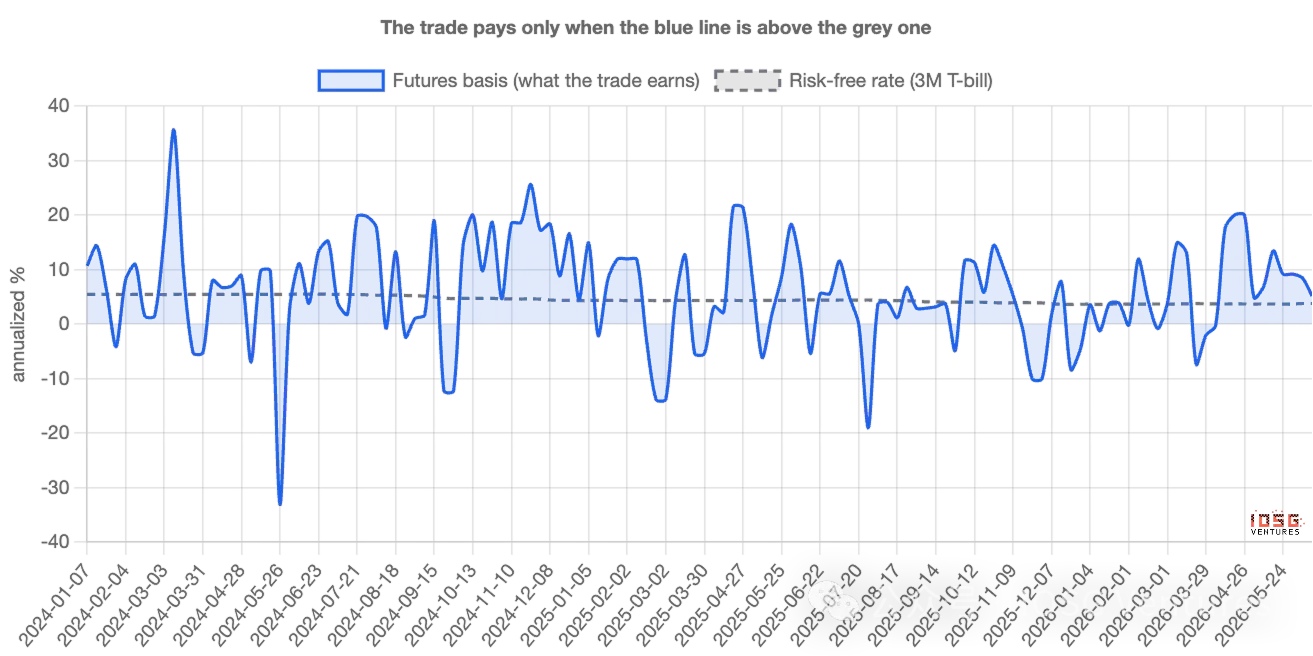
Let's see what happens at expiration. If Bitcoin skyrockets to $120, the trader makes $20 on the coin but loses $17 on the contract—net gain of $3. If it crashes to $80, the trader loses $20 on the coin but gains $23 on the contract—still a net gain of $3. If it remains flat, it's still $3. In any scenario, the profit is the same. The direction is hedged away, a situation referred to as "delta neutral." This $3 difference, annualized, represents the basis—essentially an interest rate earned while capital is parked in this trade; as long as it’s higher than the risk-free return from U.S. Treasury bills (T-bills), the trade is worthwhile.
Why This Distorts the Headline Number
The key is here. The first leg—buying 1 Bitcoin—a very common practice is to buy ETFs. Thus, a delta neutral trader with no viewpoint on Bitcoin appears in the data as an ETF inflow, indistinguishable on the surface from actual believers.
When a large number of cash-and-carry trades are established, inflows appear robust, and the narrative that "institutions are increasing positions" naturally takes hold—despite the fact that these funds are hedged and would immediately reverse once the trade is no longer profitable. In other words, fund flow figures do not merely reflect belief; they reflect the level of activity in arbitrage trades. The problem is how to separate the two—and how large each truly is.
How to Distinguish Between the Two
Cash-and-carry traders will leave a second footprint. For every dollar's worth of Bitcoin they buy, they short an equal amount in futures on the CME (the regulated U.S. exchange where institutions trade Bitcoin futures). True believers leave only the first footprint; arbitragers leave both.
And the second footprint is public. U.S. derivatives regulators publish reports weekly, disclosing the long and short positions of various traders on the CME. One category—leveraged funds, essentially hedge funds—is where cash-and-carry traders congregate. Thus, you can compare weekly inflows into ETFs with the new short positions established by these funds. If "demand" really reflects belief, then the two should not be closely correlated; if a significant portion is this hidden trade, they should move in the same direction.
II. The Data Says: Fund Flows Follow Futures, Not Prices
The two move closely in sync. Since the launch of the ETF, during every week when new futures shorts increase, ETF fund inflows also increase—almost one-to-one. About half of the weekly fund flow variance can be explained solely by this one factor: how many new shorts the funds establish. The correlation stands at 0.70, a strength of association you would see between two obviously related, not coincidental, phenomena.
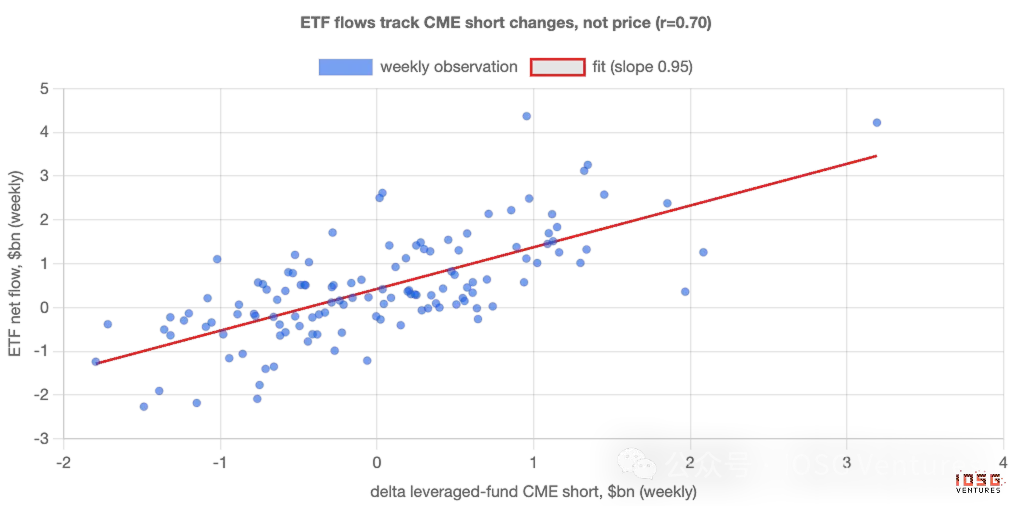
One thing that should alert believers: the price itself explains almost nothing. Testing whether the weekly Bitcoin returns can predict ETF fund flows yields results statistically indistinguishable from zero. The funds each week are not chasing performance; they are moving in sync with a hedged interest rate trade.
Therefore, as a weekly signal, ETF "demand" is primarily arbitrage. Fund flow figures are a poor thermometer for measuring belief because their fluctuations are the result of the basis trade being repeatedly switched on and off, rather than anyone changing their view on Bitcoin.
But how much of the funds really is this trade?
It is here that the blunt rhetoric—"it's all fake"—falls apart, and the real story is more interesting. The basis trade drives weekly volatility, yet has never been the mainstay of funds.
Breaking down each week’s inflow into the part explained by futures shorting (hedged) and the rest (directional), then aggregating since issuance. Of the approximately $55 billion accumulated inflow into ETFs, the current net amount from basis trades accounts for roughly $1 billion—the rest is stable, directional buying. This buying averages about $400 million per week, week after week, regardless of the basis or price, compounding over two years to account for nearly the entire "mountain."
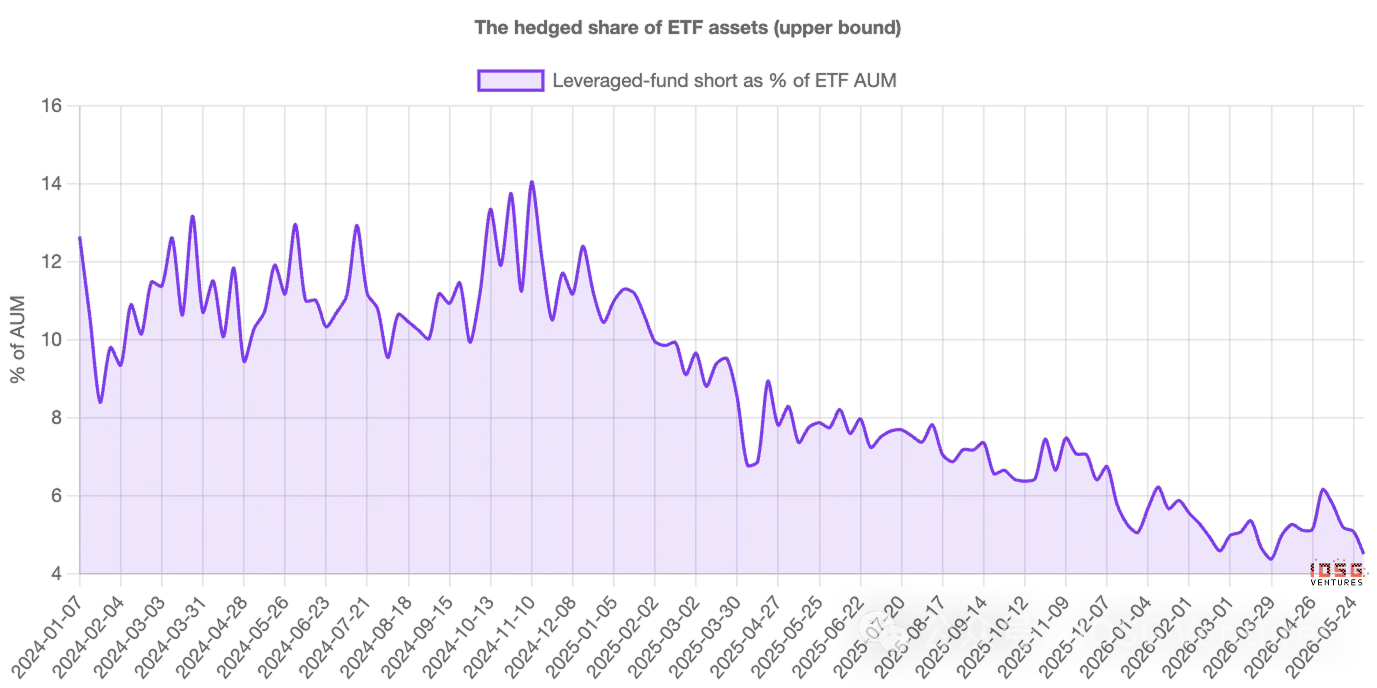
Looking at asset proportions rather than fund flows shows the same picture: the hedged portion once approached 14% of ETF assets in 2024, now around 4%-5%. At its peak, it was a significant minority; now it's just a small fraction.
Thus, a more accurate statement is: ETF fund flows overestimate the volatility of belief, not its level. The weekly ups and downs are largely "rented"—arbitrage capital comes and goes; however, the assets that truly settle down are mostly "owned." This trade stirs within the fund flow data but never constitutes the bulk of the balance.
And this trade is exiting
The hedged part not only remains small but has been shrinking for two years. The short positions of leveraged funds piled up from about $3 billion at issuance to around $14 billion by the end of 2024, then steadily dropped to about $4.5 billion. This arbitrage trade has been unwinding throughout the entire period, not just recently.
This is crucial for interpreting the present situation. Entering June, hedge positions roughly halved—funds' shorts decreased from about $6.4 billion to $4.3 billion—while the ETF experienced outflows of $300 to $500 million per day. Looking solely at the surface numbers, this looks like panic selling. But in conjunction with futures data, this is merely the routine clearing of a previously profitable interest rate trade. The same outflow numbers tell two completely different stories.
As the basis compresses, demand wanes
The cleanest evidence is what happens when this trade becomes unprofitable. When that $3 difference narrows to approach the level that traders can earn risk-free, the trade becomes unworthy of execution. If a significant part of the weekly demand is indeed this trade, then demand should weaken precisely when the spread compresses—and that is indeed the case. Observing moments before and after a compression without trends: ETF fund inflows drop below their typical rhythm while funds simultaneously cover shorts, both happening in sync. Demand and trade breathe together.
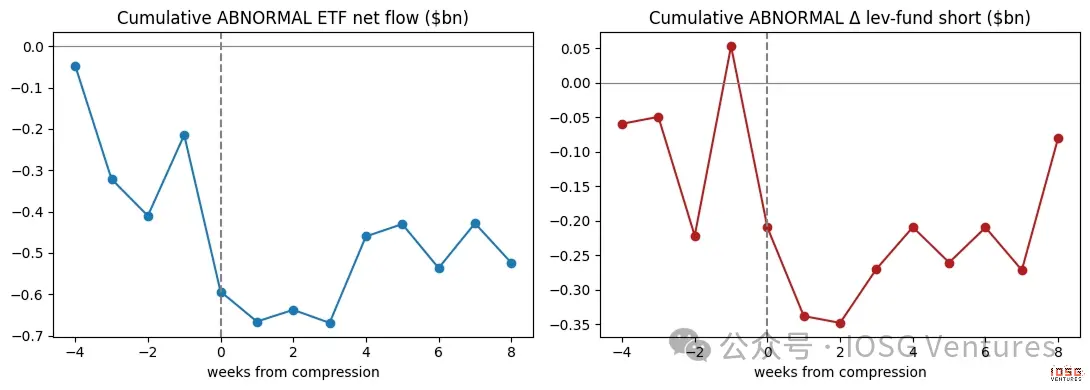
True believers do not care about futures basis. But this weekly "demand" clearly does.
III. Who Leads and Who is Really Operating
First, this correlation is synchronous—the tightest within the same week, with no clear leading or lagging; and the only directional evidence actually points in the opposite direction: ETF fund flows push shorts, not the other way around. This aligns with a paired trading logic: first buy ETFs, then short futures follow, rather than shorting "magically" generating inflows. Second, the arbitrage crowd is not the only driver. Fund flows closely follow leveraged fund shorts but also resonate with directional institutions' positions—both types of buyers are active. This article contends that not every inflow is a hedge; rather, hedge trading is the tightest, most reliable driving factor in weekly volatility.
Ethereum: The Same Trade, but Hardly Adds Up
Applying the same test to Ethereum ETFs shows the characteristics still exist but are weaker—the connection with futures shorts is more tenuous, and the underlying stable directional buying is nearly non-existent. The reason is clear. Holding spot Ethereum instead of futures means forgoing the staking returns that Ethereum provides, approximately 3%-4% annually. After factoring this in, Ethereum's basis often turns negative—arbitrage trades often cannot reach its threshold returns. Therefore, Ethereum ETFs lack strong belief buying and do not have robust arbitrage positions to support them; they are simply smaller and noisier versions of Bitcoin's counterparts.
IV. How to Interpret ETF Fund Flows from Now On
The key point is not to judge prices but rather to interpret fund flows. When the basis is rich, expect "institutional demand" to seem strong and largely hedged—do not misinterpret this strength as belief. When the basis compresses, expect fund inflows and shorts to decline—do not misinterpret the resultant outflows as the market passing judgment on Bitcoin. The two numbers worth tracking are: the annualized basis return relative to T-bill rates, and the net shorts of leveraged funds in the weekly CME reports. They will tell you how much of the next "demand" headline is real.
How We Calculated
A few honest limitations. The basis is constructed from the recent month's CME futures contracts to spot, excluding the last few days before expiration (where its very short time to expiration can magnify rounding errors into false spikes); the sequence built per contract sharpens the exact figures, but does not change the conclusion. There is a strong co-directional relationship between fund flows and shorts, rather than one causing the other—it’s important to note that they are two halves of the same trade. The futures short figure is the upper limit of the proportion of ETF buys being hedged, as some shorts hedge coins held elsewhere.
None of this alters the main understanding. From a weekly perspective, the "demand" for Bitcoin ETFs is primarily a hidden interest rate trade, not belief—fund flows measure the level of activity in arbitrage far more accurately than they measure conviction. And that real buying is genuine, patient, and has now become the vast majority left behind, because the "rented" part has spent two years returning home.
免责声明:本文章仅代表作者个人观点,不代表本平台的立场和观点。本文章仅供信息分享,不构成对任何人的任何投资建议。用户与作者之间的任何争议,与本平台无关。如网页中刊载的文章或图片涉及侵权,请提供相关的权利证明和身份证明发送邮件到support@aicoin.com,本平台相关工作人员将会进行核查。


