Coin Circle Liying: 6.24 Bitcoin (BTC) and Ethereum (ETH) Latest Market Analysis
The current price of Bitcoin is 62500, family, this market really feels like riding a roller coaster! From a high of 67255 it has slid down all the way, now hovering around 62220. Looking at the candlestick chart with red and green alternating like a whack-a-mole, us ordinary players shouldn't panic, let's first understand how to read the market before taking action. Moving average system: EMA7, EMA30, EMA120 are all pressing above the price, indicating that both short-term and medium-term trends are bearish, the bulls need to overcome these lines before a reliable rebound can happen. The MACD bearish momentum is quite strong, making short-term reversal quite challenging. The Bollinger Bands are also supporting this view, with the price drifting between the middle band 63859 and the lower band 62045, where the middle band has become a resistance level and the lower band is temporary support. If it breaks below the lower band, it may trigger a new round of decline; but if it holds at the lower band, a small rebound may occur.
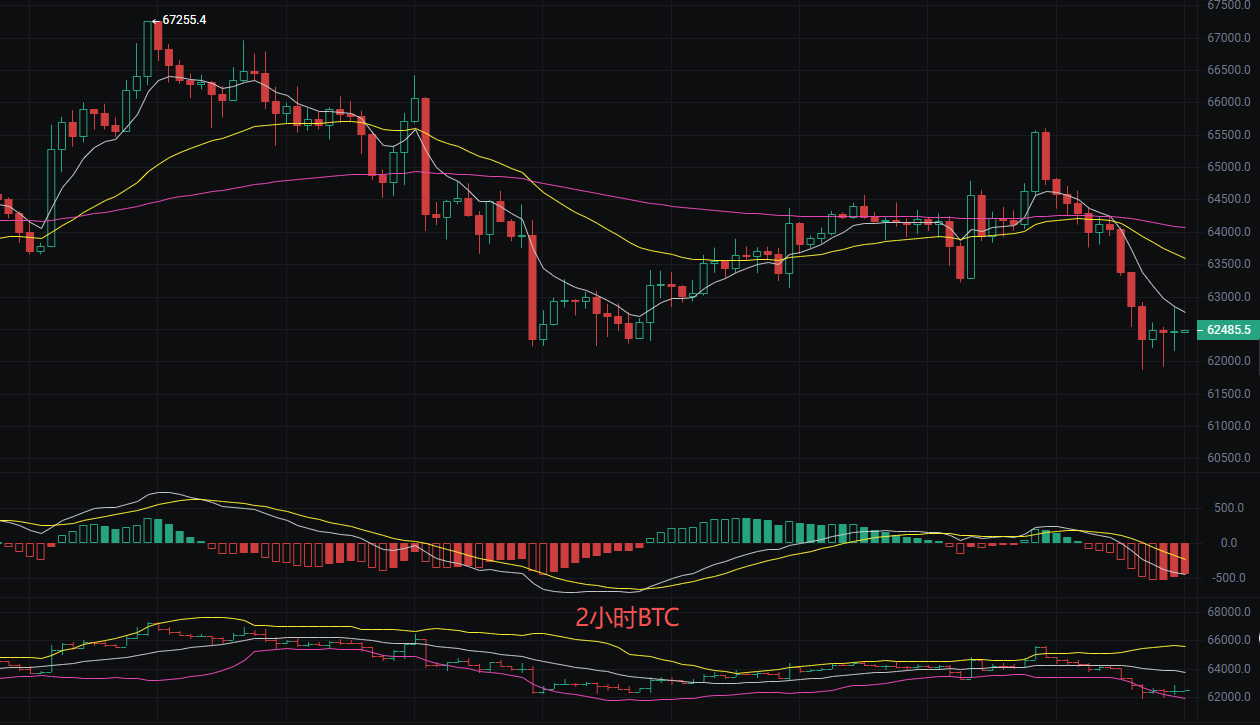
Short-term strategy reference:
For bullish positions 62000-61500, stop loss at 61000, target 63000 aiming at 64000.
For bearish positions 64000-64500, stop loss at 65000, target 63500 aiming at 62500.
Ethereum
Before publishing, the current price of Ethereum is 1660, the price is hovering around 1655, we need to clarify what's going on. From the chart, it recently surged to 1848 before constantly declining, and the recent rebound hasn't been able to hold, now it's probing down again. Simply put, it can’t rise and there’s no bottom in sight, both bulls and bears are battling it out here. The short-term line EMA7 has already crossed below EMA30 and EMA120, forming a death cross, indicating that the short-term trend is dominated by bears; moreover, the price is firmly pressed down by the three moving averages, making breakthrough difficult. The MACD bearish momentum is increasing, suggesting that the decline is not yet over. Finally, looking at the Bollinger Bands: the price is walking along the lower band, which is currently a support level, but if it breaks below the lower band, it will open up new downward space; the upper band is at 1793, posing significant pressure for short-term rebounds. Overall, all three indicators point to bearish dominance, but the lower band of the Bollinger Bands may hold for a bit, so this key position must be closely monitored.
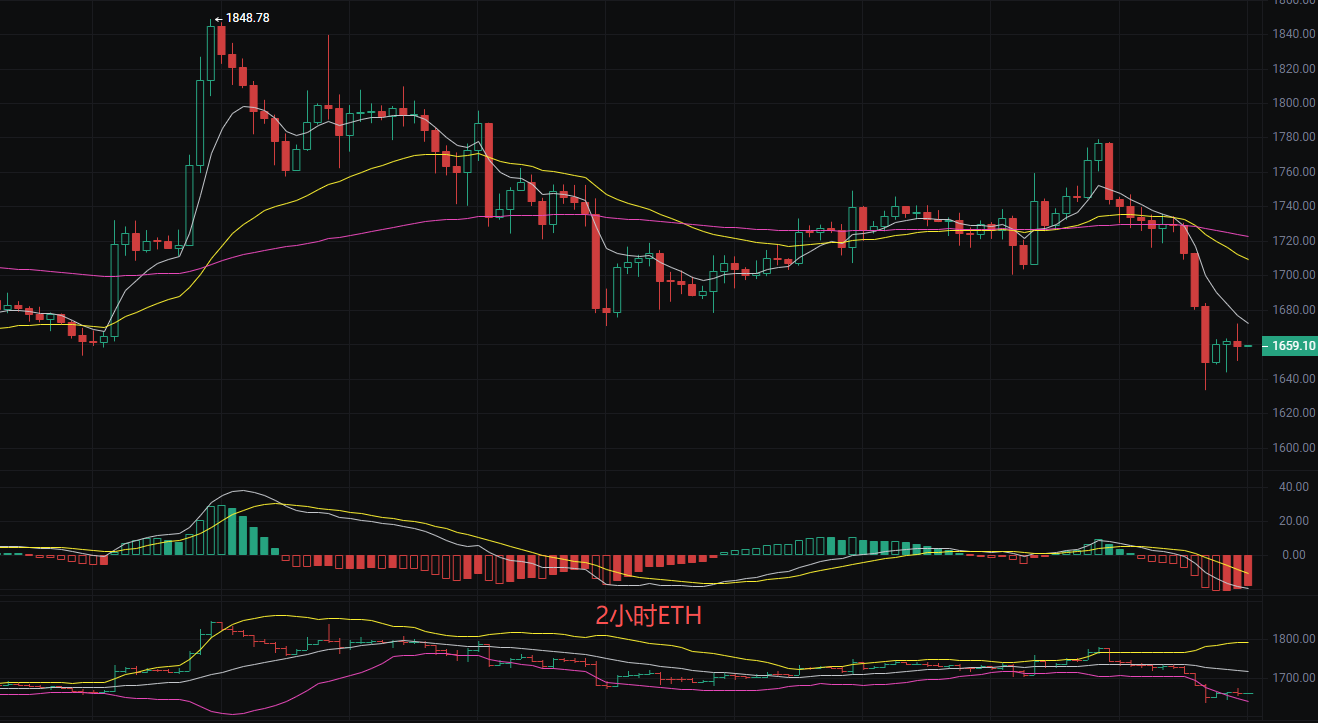
Short-term price reference:
For bullish positions 1640, defensive level at 1600, stop loss at 1550, target 1700 aiming at 1750.
For bearish positions 1700, defensive level at 1750, stop loss at 1800, target 1650 aiming at 1600.
The above content is exclusively original by Liying, please indicate the source when reprinting! Article publication review has a time lag, and market conditions change rapidly, the above suggestions are for reference only, risk is to be borne by yourself.

Warm reminder: The above content is solely created by the author of the public account, the advertisements at the end of the article and in the comments section are unrelated to the author, please identify cautiously, thank you for reading.
免责声明:本文章仅代表作者个人观点,不代表本平台的立场和观点。本文章仅供信息分享,不构成对任何人的任何投资建议。用户与作者之间的任何争议,与本平台无关。如网页中刊载的文章或图片涉及侵权,请提供相关的权利证明和身份证明发送邮件到support@aicoin.com,本平台相关工作人员将会进行核查。