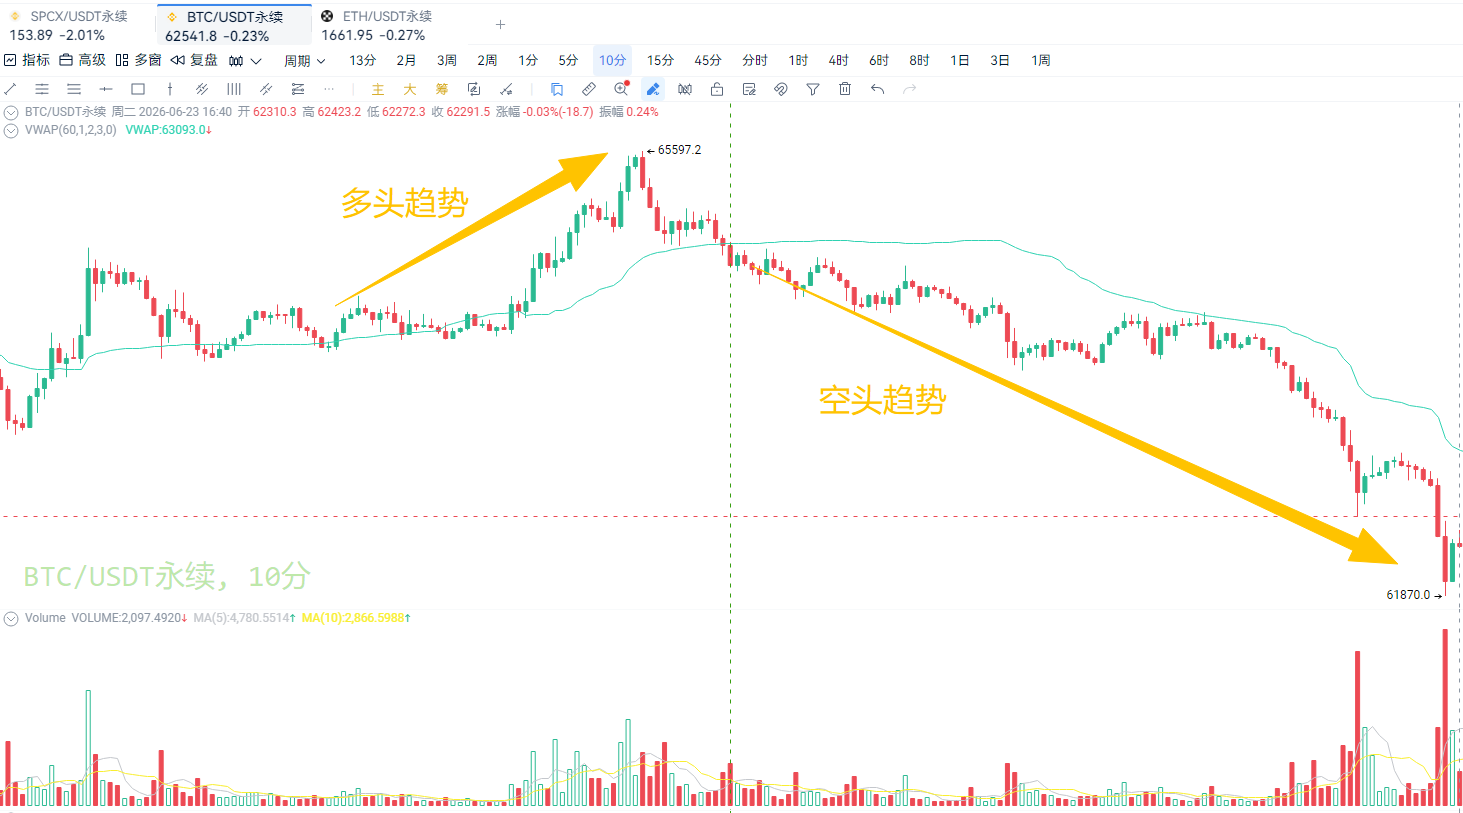
Let me ask everyone, did you catch this drop? Waking up from a nap, the market has completely turned, dropping almost two points. In fact, our alerts had already warned that the main force on the HL platform was intensively building long positions, with $125 million in long orders exiting directly. The red circles marked in the picture show the market orders of the main force. If you had checked the alerts at the time, you would know the main force had withdrawn and definitely couldn’t blindly go long; the space for this drop could basically have been grasped. 
By the way, you all remember the SPCX IPO, right? It has dropped quite a bit recently, completely erasing the rise from the IPO stage, now falling to 1146. Looking at its main force data, you can understand from the red and green circles that the main force has already started building short positions in batches, with four waves of large sell orders flooding in, complemented by the position difference—red bars on top indicate an increase in positions, combined with active sell orders, which clearly signals the main force is shorting. However, there's a detail to pay attention to, the LSUR indicator has been rising, indicating that many retail investors are rushing in to buy the dip. I hope friends in our live room do not blindly join this excitement; stepping into this storm can be dangerous.

Just now, a friend asked, what counts as a signal of stopping the decline? Actually, it can be categorized into three types: one is technical indicators, such as bottom divergence, momentum decay, and oversold rebounds, depending on what indicators you usually prefer; the second is pattern structures, such as triangle consolidation and flag breakout, suitable for those who like to draw lines; the most direct type is to observe the main force's signals. See if the main force has finished closing out their short positions and whether their real money has entered to go long—only when new funds enter can it be considered a reliable signal of stopping the decline. For example, in the market, there appeared a cluster of large sell orders, valued at $97.51 million, but the open interest was decreasing, indicating that the main force was closing long positions to take profits, not opening new shorts. Then looking at the counter orders, it’s also the main force closing long positions, likely the large holders who entered over the weekend are cashing out. In simple terms, the main force has just taken their profits and left, but no new large funds have entered to buy the dip, so it doesn’t count as a signal of stopping the decline yet; it’s safer to wait. If you want to wait for a support signal, look below for large buy orders waiting to be filled, that’s real support. Right now, there’s neither support, and the main force is still exiting, so there’s really no need to rush in.
Back to our topic today—how to see through the real and false actions of the main force. Usually, when people watch the market, some love staring at K-line patterns, such as hammer patterns, shooting stars, and top formations; others prefer using technical indicators, support from moving averages, MACD golden crosses and dead crosses. These are all useful, but they have a common point: they are all results derived from historical price movements, and inherently carry some lag. To understand why the market is rising or falling, we still need to look at the main force's funds. The market essentially follows the 80/20 rule, with 80% of funds concentrated in the hands of a few main forces; when they act, the market will experience significant volatility. A large bullish candle appearing is most likely due to the main force aggressively increasing their holdings. Therefore, if you want to catch turning points, paying attention to the main force's trading behavior is much more reliable than just looking at K-lines.
Let’s continue discussing the main force’s transactions. In fact, from the perspective of the order book, there are two types: one is limit orders, which are the bars that the main force has placed on the order book in advance, passively waiting for others to fill them. 
For example, the previously mentioned over $60 million limit long order could be seen in the order book in advance; it’s passive limit orders, primarily for show to the market. The other type is market orders, which are these red and green circles—these indicate the main force taking active action by directly consuming the orders on the order book. Red circles indicate active selling, green circles indicate active buying, and the larger the circle, the higher the single order amount. Among these two types, market orders are the key—because active transactions do not consider fees and slippage, they focus on speed and accuracy, best reflecting the real intentions of the main force. Whether they are eager to accumulate holdings or panicking to sell off can be discerned from the direction, frequency, and intensity of market orders. Simply put: limit orders may be a show for you, while active transactions are the real money being operated by the main force.
Talking about concepts is too dry; let’s look at practical cases. You all remember the 50% surge in UNI from last week, right? The main force’s actions in this coin are particularly typical, with a clear trace from washout, accumulation, surge to distribution and sell-off. Let’s look back at June 15th, when Binance’s UNI contract had two large limit short orders, one for $450,000 and one for $490,000. If you only looked at the limit orders, you might have followed along to short, but checking the market transactions—these two short orders were all actively bought up by the main force. This is a very typical washout signal: they placed short orders to drive out retail investors and then turned around to scoop the chips back. From June 7th to June 14th, the focus of UNI’s chips, POC, stayed steady at 2.51 without moving, only the value range was narrowing, which was not a selling pattern at all, but rather the main force was washing out and shaking the positions. Once they were done washing, the main force started to act. Just in time, on the night of the 15th, Standard Chartered Bank released a research report, bullish on UNI, saying it could rise to $100 by 2030, and provided annual target prices, the core logic being that RWA assets will go on-chain, with UNI becoming core infrastructure. With such good news coupled with the actions of the main force, the market directly shot up.
Let me analyze a detail for you: at the beginning of the rise, the LSUR indicator was declining. LSUR is the ratio of long to short position holders; a decline indicates that more retail investors are shorting—meaning while retail investors are still bearish, the main force has already started quietly accumulating. On the evening of the 15th, the main force began actively scooping up, with a single order of $650,000 charging in; by the 16th and 17th, the transaction intensity increased even further, with single orders directly hitting over $6 million, and dense active buy orders sweeping up, clearly indicating accumulation. Once the price was pulled up, retail investors reacted and rushed in to buy. At this point, LSUR began to rise together with the open interest; both the main force and retail investors went long, pushing the market the fastest.
Some friends ask, what amount constitutes unusual activity? This depends on the coin. For Binance’s BTC perpetual contracts, I generally look for orders over $10 million or even $30 million; for mainstream coins in spot trading, I watch for over $5 million; for altcoin contracts, orders over $500,000 or $600,000 are considered large. It ultimately depends on the average transaction level of the coin; for instance, since SOL generally has large orders, the threshold must be raised to above $1 million.


Now let’s look at the signals at the top. After reaching the peak, the net transaction amount was only $880,000, which doesn’t seem like a big difference, but looking deeper reveals otherwise: the strength of buy orders is weakening while the strength of sell orders is increasing. The quantity and size of green circles are shrinking, while red circles are increasing, the signal of buying weakness and selling strength is particularly evident, and at this point, one should consider closing long positions, and can even tentatively try shorting. The subsequent drop of about 12% was even more pronounced, with dense active sell orders flooding in, and looking at the position difference, the red bars were shortening, and open interest was decreasing, combined with active sell orders, which indicates that the main force was closing out long positions. At this time, when we look at LSUR, it spiked from 1.38 to 1.66— the main force has all left, but retail investors are still buying as the price falls, trying to catch the dip, which is the most dangerous. Later, the price fell all the way down, with LSUR maintaining a high level, indicating that throughout the process, it was retail investors holding up the market while the main force had long withdrawn. If one fails to understand the main force's direction, they could easily become trapped among those trying to catch the bottom.
So let me summarize a rule for you: An increase in open interest + main force actively going long + declining LSUR is the most reliable signal of the main force quietly accumulating, indicating a bullish signal; a decrease in open interest + main force actively selling + rising LSUR indicates the main force exiting, with retail investors taking over, likely leading to further declines. Using this indicator, you can fully observe the main force's complete series of actions from "washing - absorbing - lifting - dumping," significantly reducing the probability of falling into traps. Let’s not be those who buy more as the price drops; we should wait for the stop loss signals to emerge and operate on the right side, without catching bottoms in mid-air, turning into fuel for the market.
Let's talk about an even more interesting case—a trap deliberately set by the main force to lure buyers; last week’s ZEC is a particularly typical example. On the 17th, a large holder placed a limit order for $15.29 million at position 509, which was a particularly large amount, rarely seen in altcoins, seeming like strong support. If one only looks at the limit order, they might assume the main force is supporting the market and rush in to long. But if you look at the market transaction data: the main force actively sold $16.45 million, which is actually more than the buy order. In short, placing large buy orders was just a show for you, creating the illusion of someone supporting the price, but the real goal was to secretly unload their positions. This represents a standard lure-to-buy trap. That buy order did provide short-term support for the price, but couldn’t withstand the continual flow of sell orders, the unloading strength far exceeded the support strength, showing it was not genuinely there to protect the price. Furthermore, the $510 position happened to be the POC point for the chips, and with double pressure, it couldn’t hold up, leading the price to fall all the way down, trapping all those who rushed in. At that time, our alerts also pushed this signal, reminding everyone that the active selling pressure was leading, do not rush in just because of the support order. If one had understood the situation back then, they could have shorted alongside the main force and benefited from it.
Let me provide another case—it was previously mentioned in the last live broadcast, that $165 million short order for BTC. At that time, many people saw such a large short order and thought the price was about to drop significantly; instead, the price went up. Why? Understanding the market transactions clarifies this: that short order came out, but was immediately consumed by a $169 million active buy order. The buying force was even more aggressive, actively absorbing all the selling pressure and naturally pushed the price up. Whether it was the main force trading against itself or genuine bulls stepping in, the result was that the selling pressure was absorbed. Only looking at the limit order pressure to short can easily lead to being trapped. Understanding active transactions will help eliminate confusion over "How is the price still rising when there's so much selling pressure?"
There’s also a hidden operation of the main force that can be revealed through large transactions—unloading through splitting orders. Let’s analyze the case of Ethereum, where every four or five seconds, an order of about 1571 Ethereum was completed, amounting to nearly $1 million each. The consistency of transaction intervals and quantity indicates that this is the main force splitting orders, using iceberg orders to break a large order into smaller ones to sell in batches, hiding their unloading intentions to prevent crashing the market at once. Overall, this wave saw the main force unload over $17 million worth, split into 17 transactions sold slowly. You might think it's scattered small orders; in fact, it’s the same main force on the run. So don’t think the main force splitting orders can’t be detected; by observing transaction patterns and quantities, they can also be pinpointed—this is the same in the stock market.
In conclusion, the indicators for large transactions can reveal a lot: unusual activity of single large orders, continuous concentrated operations by the main force, and hidden movements from order splitting—all can be tracked. We learn this not to work against the main force but to understand what they are doing, to not be washed out of the market and to avoid being trapped by lures to buy. Trading by following the main force is always more reliable than running erratically with the emotions of retail investors.
Currently, there are live broadcasts every day, and we welcome you to keep following the AiCoin community! Reserve early 👇
https://www.aicoin.com/zh-Hans/live/list?tab=upcoming
This article only represents the author's personal opinions and does not represent the platform's stance or views. This article is for information sharing only and does not constitute any investment advice to anyone.
免责声明:本文章仅代表作者个人观点,不代表本平台的立场和观点。本文章仅供信息分享,不构成对任何人的任何投资建议。用户与作者之间的任何争议,与本平台无关。如网页中刊载的文章或图片涉及侵权,请提供相关的权利证明和身份证明发送邮件到support@aicoin.com,本平台相关工作人员将会进行核查。