Cryptocurrency Circle Liying: Latest Market Analysis of 6.25 Bitcoin (BTC) and Ethereum (ETH)
Bitcoin's current price is 60300, which has dropped from a high of 74250 to around 60000, now fluctuating around 60500. After dropping to 59080, it experienced a rebound, but recently it has started to dip again, feeling like a roller coaster. Many people are asking if it’s still possible to buy the dip or should they cut losses; first, note that all moving averages are pressing down on the price, with short-term, medium-term, and long-term trends all in a bearish arrangement. When the price rebounds to these moving averages, it is likely to get knocked down. The MACD's downward momentum has not weakened, making it difficult for bulls to launch a counterattack. The Bollinger Bands are more intuitive, with the current price close to the lower band; if it breaks below the lower band, it could trigger a new round of declines; however, if it holds, there may be a chance for a rebound after an oversold condition.
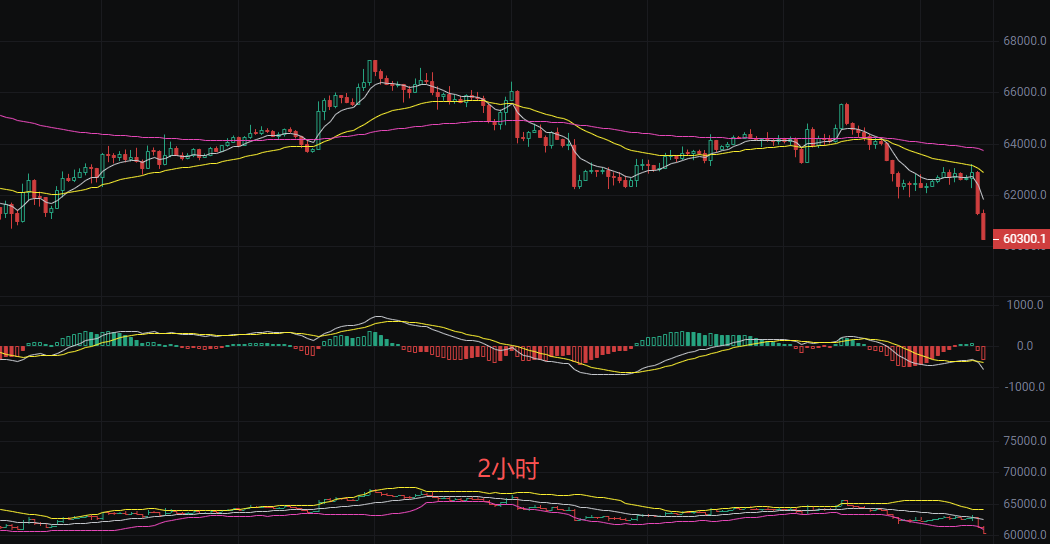
Short-term trading ideas reference:
Buy around 60000-59000, stop loss at 58000, target 61000 aiming for 62000
Sell around 61500-62000, stop loss at 62500, target 60500 aiming for 60000
Ethereum
Before publishing, the current price of Ethereum is 1620, now stuck near the lower Bollinger Band, with moving averages also firmly pressing down, feeling like both bulls and bears are holding back for a big move. As retail investors, let’s not guess tops and bottoms randomly; first monitor what signals the indicators give and act accordingly. The EMA moving averages are in a bearish arrangement, with the short-term EMA7 pressing down from above, and the medium-term EMA30 and long-term EMA120 blocking upward movement like three walls, indicating that the downtrend hasn't reversed. The MACD's DIF and DEA are below the zero line, the green bars have shortened but haven't turned red yet, showing weak momentum like an engine running out of fuel; the Bollinger Bands are narrowing, with the mid-band at 1671 acting as resistance and the lower band at 1620 serving as support, with the price oscillating near the lower band, indicating a high probability of selecting a direction to break through.
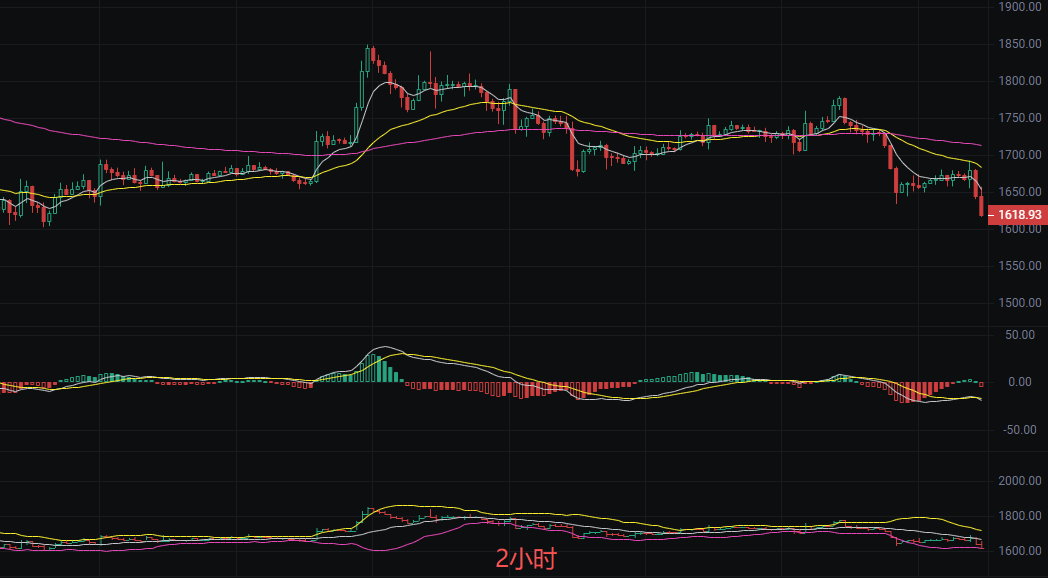
Short-term point of reference:
Buy around 1620, stop loss at 1580, target 1660 aiming for 1720
Sell around 1680, stop loss at 1720, target 1650 aiming for 1600
The above content is an original exclusive by Liying, reposting requires citing the source! Articles may have delays in publication review, the market is changing rapidly, the above suggestions are for reference only and risk is borne by the reader.

Friendly reminder: The above content is solely created by the author for the public account, advertisements at the end of the article and in the comments section are unrelated to the author, please discern carefully, thank you for reading.
免责声明:本文章仅代表作者个人观点,不代表本平台的立场和观点。本文章仅供信息分享,不构成对任何人的任何投资建议。用户与作者之间的任何争议,与本平台无关。如网页中刊载的文章或图片涉及侵权,请提供相关的权利证明和身份证明发送邮件到support@aicoin.com,本平台相关工作人员将会进行核查。