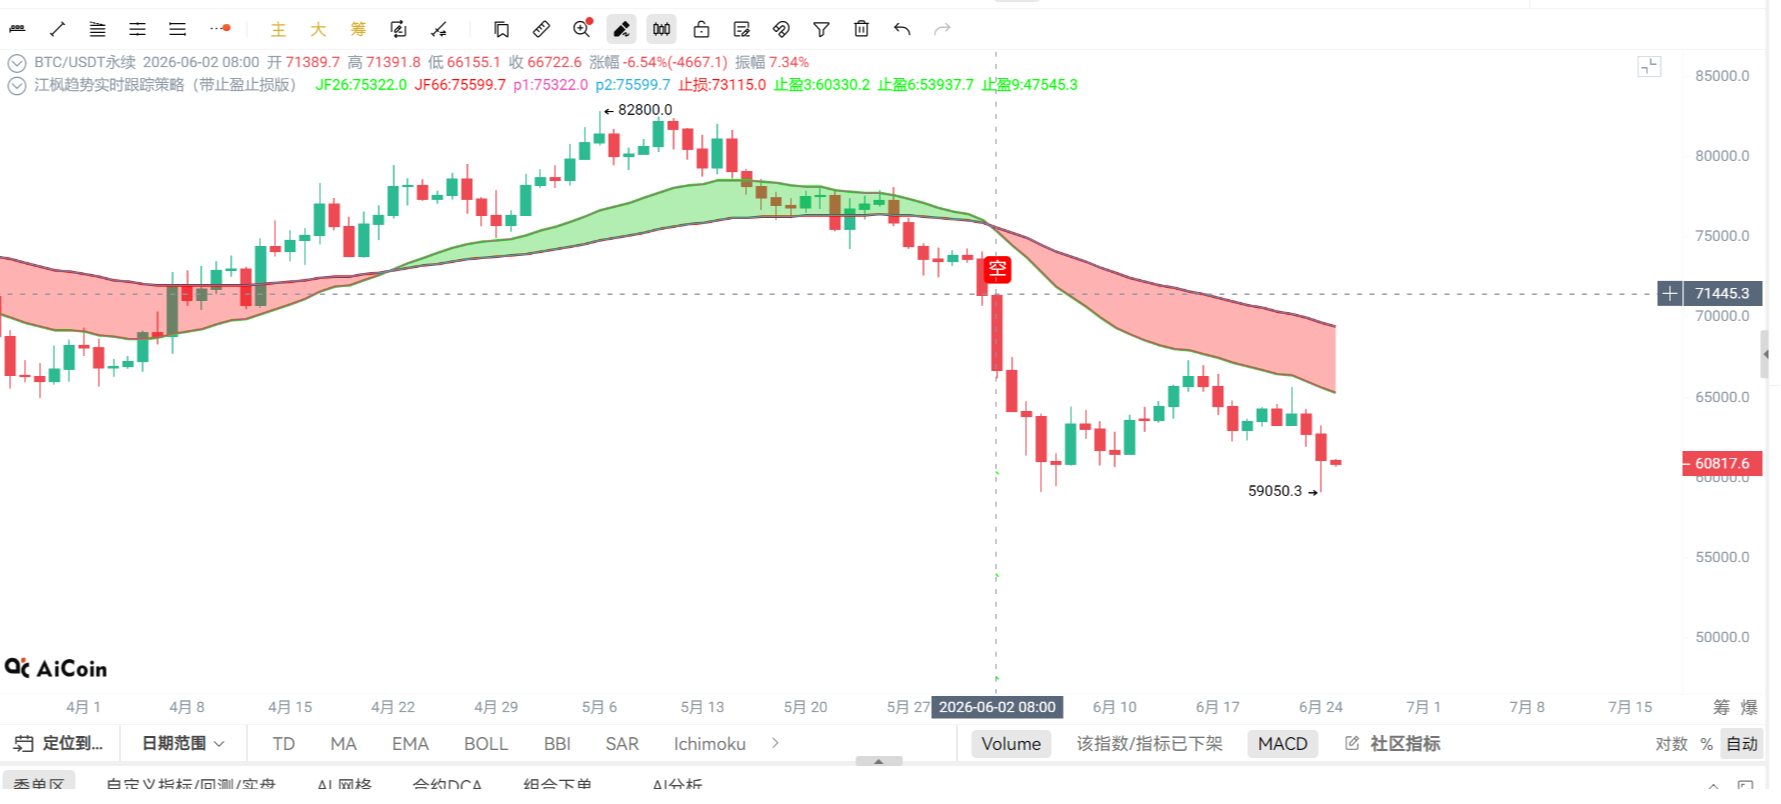
Today, market sentiment is extremely pessimistic, with a significant negative news item: ETFs have seen a net outflow for six consecutive weeks, macro pressures are intensifying, and Bitcoin has fallen below $60,000, creating a new low in 20 months. At the same time, miner profits are under pressure, with 20% of mining companies having fallen below the breakeven line, increasing selling pressure risk. The combination of these two pieces of news has directly penetrated the psychological defense line of the bulls, making a short-term bearish dominance clear. However, on the flip side, Coinbase has obtained the EU MiCA license, advancing compliance processes, which is positive in the long term. Nonetheless, the current market is more focused on short-term capital withdrawal and macro pressures; we need to let the data speak, indicating a clear direction.
Current Price and Time
The current time is June 25, 10:03, with BTC priced at 60,956 USDT. The 24-hour price change is -3.63%, and the fear and greed index is only 12, falling into the extreme fear range. At this position, retail investors are panicking, but professional traders need to calmly analyze the structure.
Multi-Cycle Status Overview
On the daily chart, BTC closed below MA5, with MA5=62,420, MA10=63,308, and MA30=65,456, all showing a bearish arrangement. Although the MACD histogram is positive, DIF=-2,132 and DEA=-2,281, the fast and slow lines are crossing below the zero axis, and bearish momentum is still being released. RSI=39.11, is in a weak area but not oversold. The daily trend is clearly bearish.
On the 4-hour chart, MA5=61,032, MA10=61,816, MA30=63,268, with price under pressure below the moving average system. The MACD histogram is -257.89, DIF=-812.59, DEA=-554.69, and bearish momentum is persistently increasing. RSI=25.12 has entered the oversold area, indicating that short-term downward momentum may be exhausting, but the trend has not reversed.
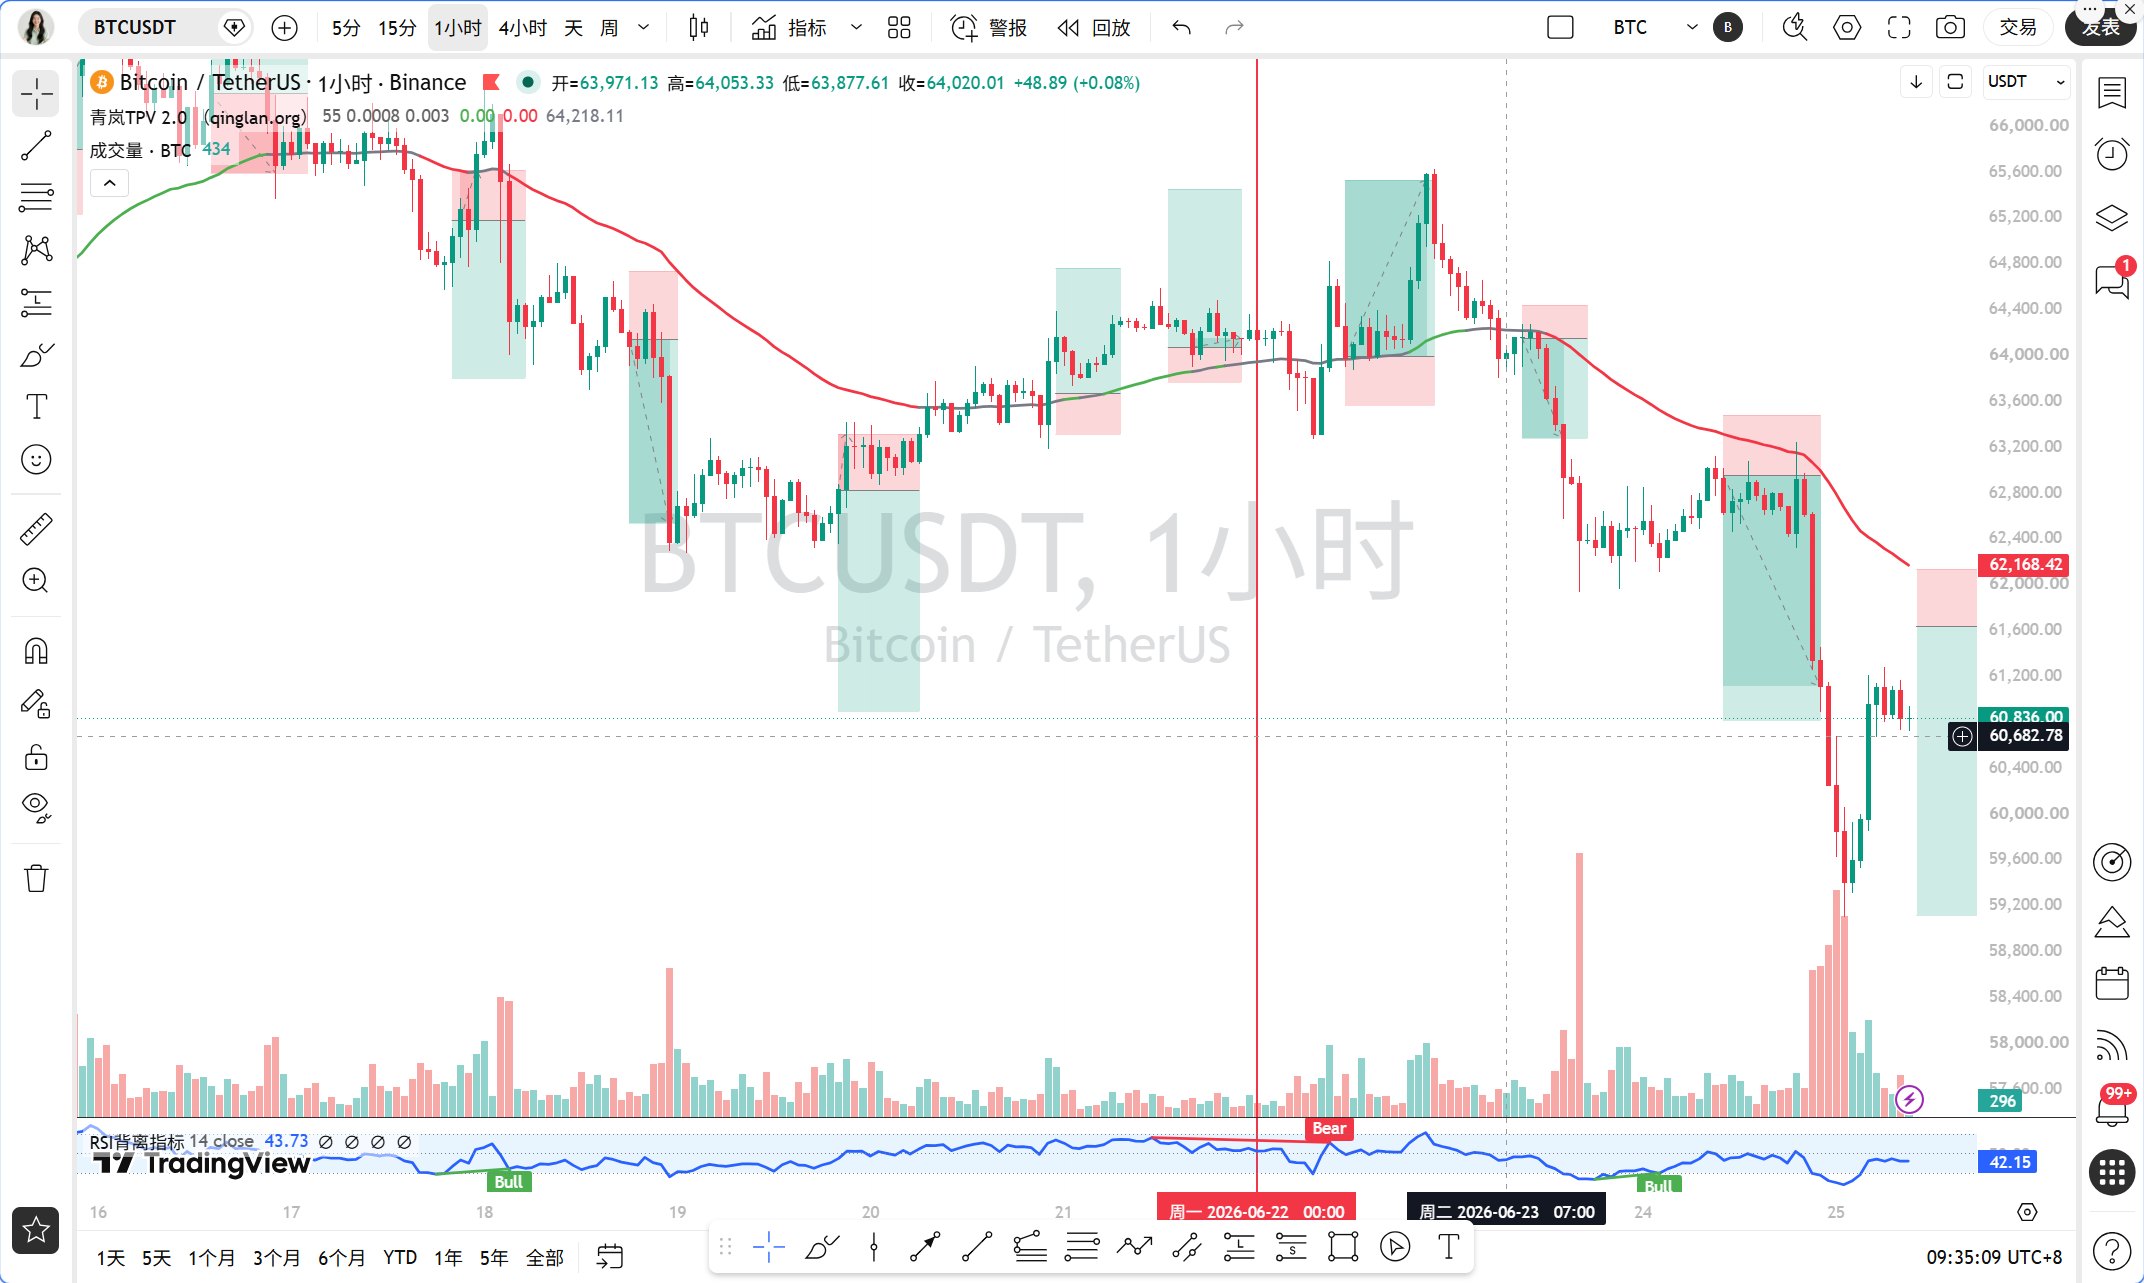
On the hourly chart, MA5=60,933, MA10=60,569, MA30=61,733, with price oscillating between MA5 and MA10. The MACD histogram is 88.88, DIF=-459.11, DEA=-547.99; the fast and slow lines are below the zero axis, but the histogram has turned positive, indicating that downward momentum is weakening. RSI=35.50 is still weak. EMA55=62,141.80, and the current price of 60,956 is far below EMA55, indicating a clear bearish trend.
On the 15-minute chart, MA5=60,869, MA10=60,911, MA30=60,721, with prices fluctuating narrowly around the moving averages. The MACD histogram is -9.95, DIF=60.21, DEA=70.15; the fast and slow lines are above the zero axis but the histogram has turned negative, showing weak short-term momentum. RSI=51.88 is neutral.
Overall, the daily and 4-hour bearish trends dominate, while the 1-hour and 15-minute charts show short-term stabilization signs but have not formed a reversal signal.
TPV Signal Verification
According to the Qinglan TPV system, we use the 1-hour EMA55 as the bullish-bearish boundary line. The current price is 60,956, significantly below EMA55=62,141.80, a margin of 1.91%, which does not meet the oscillation threshold. In the past 8 hourly candlesticks, the number of times the closing price was greater than EMA55 is 0, and the number of times it crossed is also 0, indicating a unilateral bearish trend.
Short Sell Condition Verification: First, the price is under pressure below the 1-hour EMA55, with 2 consecutive hourly candlesticks closing below EMA55, meeting the conditions. Second, the price faced strong resistance near 61,000, with the 4-hour MA5 forming a suppression, and a topping structure is present. Third, the rebound has no strength; although the 1-hour MACD histogram has turned from negative to positive, DIF and DEA are still below the zero axis, and RSI has rebounded from 35.50 but has not broken through 50, indicating insufficient rebound momentum. All three conditions are simultaneously met, confirming the effectiveness of the bearish signal.
Long Buy Conditions Not Met, as the price has not stabilized above EMA55, and the downward momentum has not completely exhausted. Currently, the market is in a bearish trend, and active long buying is not advisable.
On-Chain/Fundamentals
The Fear and Greed Index is 12, indicating extreme fear; historically, this level often corresponds to a temporary bottom, but time is needed for confirmation. BTC’s market share is 55.95%, indicating that funds are still rotating within BTC and have not significantly flowed out. However, with ETFs experiencing six weeks of net outflow, increasing macro pressures, and rising miner selling pressure, these negative factors suppress the rebound space. Both smart money and retail investor indices are neutral, indicating a lack of clear market direction, but bearish forces are dominant.
Key Support and Resistance Levels
The first resistance level above is 1-hour EMA55=62,141.80, which is the lifeline of the bearish trend. If the price rebounds to this level, it may encounter strong resistance. The second resistance level is 4-hour MA5=61,032, where the current price is oscillating near; if broken, then watch 4-hour MA10=61,816. The first support level below is the whole number level of 60,000, a psychological support; if broken, look towards previous low around 58,000. The second support level is the price range corresponding to the oversold area of 4-hour RSI, around 59,000-59,500.
Trading Ideas
Direction: Bearish is dominant, but need to wait for a rebound to resistance levels to enter, avoid chasing the shorts.
Entry Conditions: Price rebounds to near 1-hour EMA55, in the range of 62,100-62,200, while observing for a long upper shadow or topping structure in the hourly candlestick, and the MACD histogram shortening for 2 consecutive periods, with RSI declining from above 50, confirming rebound weakness before entering short.
Stop Loss Level: Set above 62,500, which is 300 points above EMA55, to prevent false breakouts.
Target Levels: First target 61,000, second target 60,000, third target 58,000. If the price breaks below 60,000, add to the short position, and lower the stop loss to 61,000.
If the price directly breaks below 60,000, do not chase shorts; wait for a rebound to the range of 60,500-61,000 to re-enter short, with a stop loss at 61,500, target 58,000.
If the price unexpectedly breaks above EMA55 and stabilizes, the bearish signal is invalidated, and shift to wait-and-see mode until a consolidation range is confirmed.
Risk Warning
The current market sentiment is extremely pessimistic, but an oversold area may see a technical rebound; strictly control stop losses and position size to avoid heavy speculation.
Follow Qinglan Crypto Classroom to capture more trading opportunities! Welcome to visit the official website www.qinglan.org
Qinglan Crypto Classroom reminds: Data-driven trading, rationally responding to fluctuations.
📊 Qinglan TPV Trading Strategy Backtest Reference
🕒 Last backtest time June 25, 07:00:01
Total analysis: 2488 Backtests: 1928 Accuracy: 71.8% (1385/1928)
免责声明:本文章仅代表作者个人观点,不代表本平台的立场和观点。本文章仅供信息分享,不构成对任何人的任何投资建议。用户与作者之间的任何争议,与本平台无关。如网页中刊载的文章或图片涉及侵权,请提供相关的权利证明和身份证明发送邮件到support@aicoin.com,本平台相关工作人员将会进行核查。