The recent price correction of Bitcoin not only tests investors' faith but also challenges the technical models that have been circulated in the cryptocurrency market. The price of Bitcoin has dropped by as much as 50% since reaching an all-time high of $126,000 in October 2025.
A shocking scene unfolded at two o'clock this morning, as the price of Bitcoin plummeted from a 24-hour high of $63,239, briefly dipping to $59,071, falling below the $60,000 psychological barrier regarded as a watershed by the market, but it has since stabilized slightly, now trading at $61,629. Ethereum also faced a severe drop, reaching a low of $1,551, and now trading at $1,643. Since the high on June 16, Bitcoin peaked at $67,268, and Ethereum peaked at $1,848, both have evaporated over 9.5% and 12% from their peaks respectively, and the downward trend shows no signs of stabilization.
Market sentiment is similarly bleak, with today's fear and greed index reported at 12, down from 17 yesterday, as the index continues to probe lower, reflecting a growing sense of panic among retail and institutional investors. The focus should be on the $60,000 level; although it briefly fell below this morning, it has since recovered, but the strength of this level remains to be verified. If $60,000 cannot hold up against next selling pressure, then Ethereum's support at $1,550 will also be in jeopardy. The Fed's hawkish expectations have yet to be fully digested, and whether ETF capital flows can reverse is also a matter worth attention.
Four-hour chart of Bitcoin
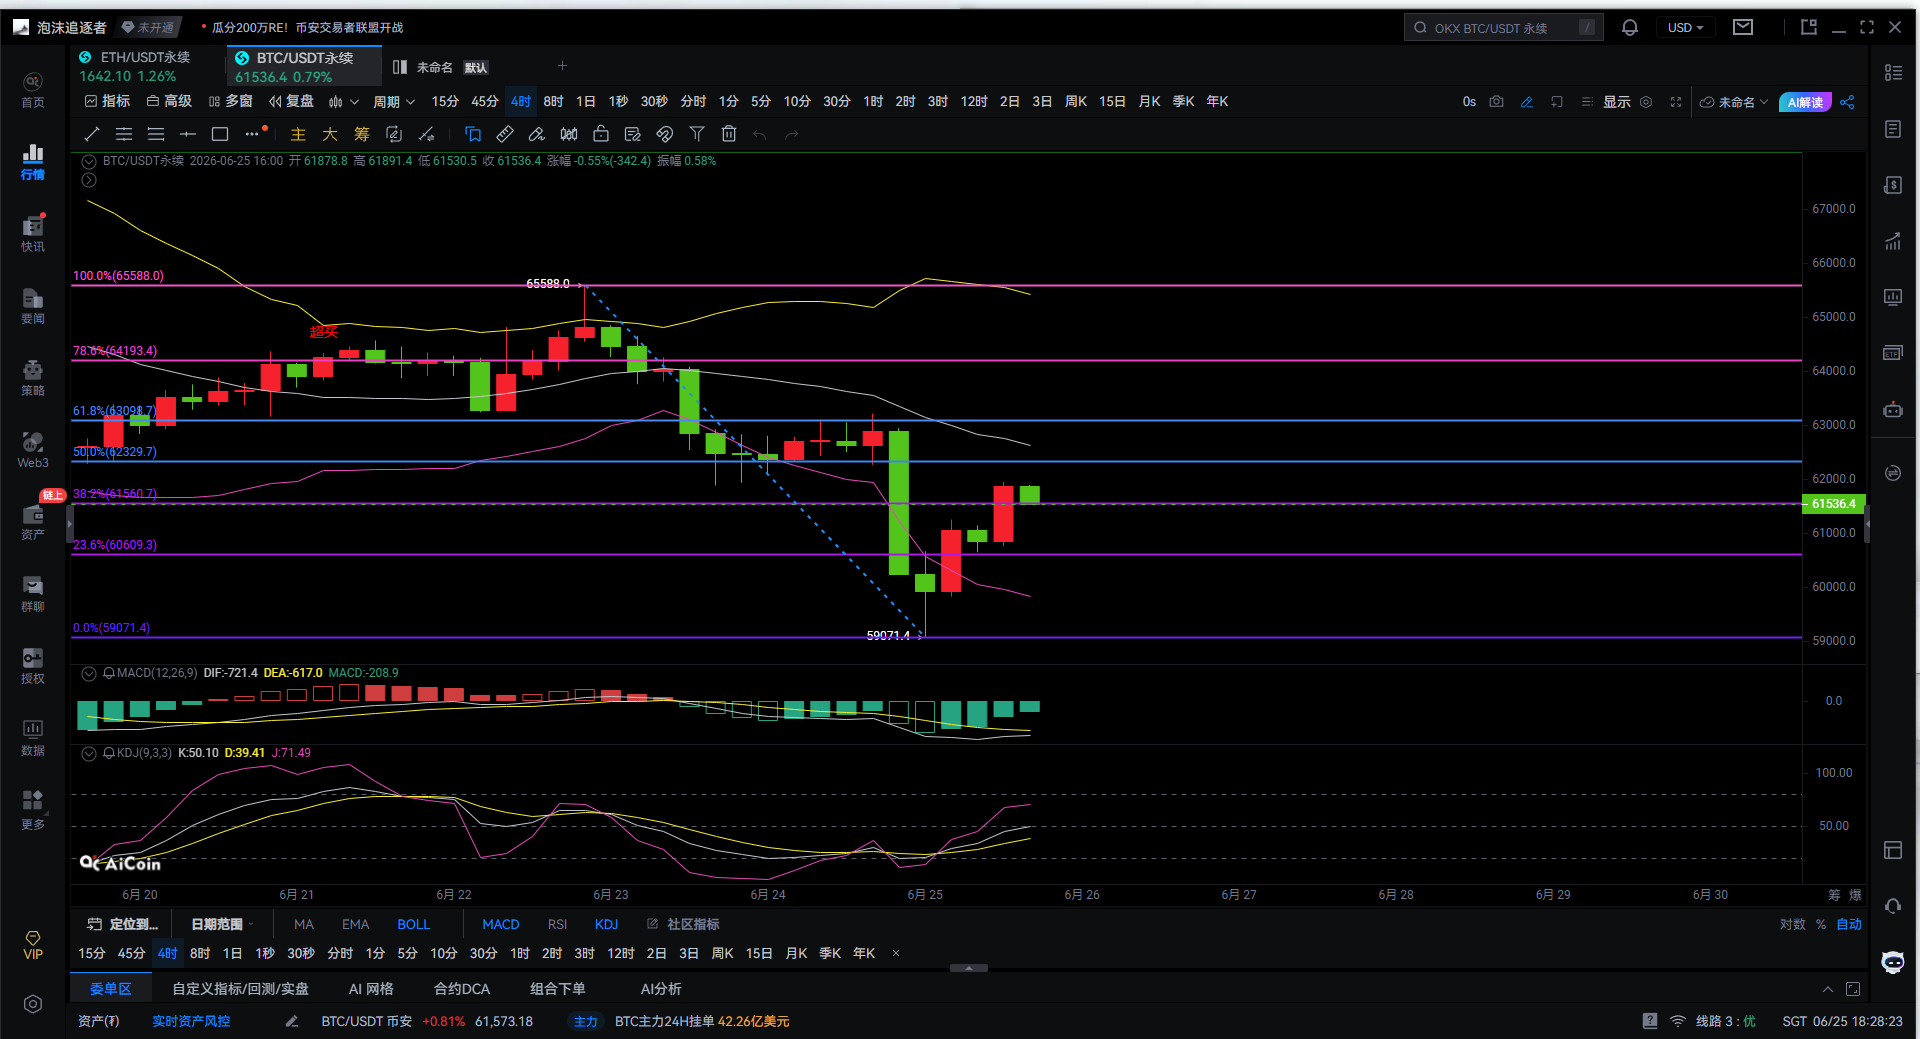
Looking at this four-hour chart of Bitcoin, the price quickly rebounded from the low of around $59,071 and is now near $61,500. I used Fibonacci, MACD, and KDJ indicators to analyze and think this uptrend is a correction from an oversold position, but whether it can become a reversal still requires waiting and observing.
First, let's talk about Fibonacci retracement. This wave's high is at $65,588, and the low is at $59,071. Key levels are: 23.6% retracement at $60,609, 38.2% at $61,560, 50% at $62,329, 61.8% at $63,098, and 78.6% at $64,193. The price has now climbed above $60,609 and is testing $61,560. This is a critical watershed for bulls and bears. If it can hold above $61,560, the next move could potentially push to the $62,330 to $63,100 area. If it breaks $63,098, the downward structure would be broken, and there would be a chance to challenge above $64,000.
Next, looking at MACD. The DIF is -721, DEA is -617, and the MACD green bars are shortening. This indicates that bearish pressure is weakening. Although the double lines remain below the zero axis, they have started turning upward, usually indicating that the initial wave of decline has ended, and the market is recovering. If the next few four-hour periods continue to rise, the DIF might cross above the DEA to form a golden cross, which, once confirmed, would bring a new wave of rebounds. Therefore, MACD is currently signaling bearish exhaustion and strengthening rebounds.
KDJ shows even clearer indications. The K value is around 50, the D value is around 39, and the J value is around 71. Previously, KDJ formed a golden cross in the oversold area and has been rising, indicating a return of short-term capital. Particularly, the rapid rise of the J value above 70 shows that the market is shifting from panic to positive recovery. However, if the J value rises too quickly and the price cannot break the $61,560 pressure, it could lead to a short-term pullback. So chasing highs now is not cost-effective.
From a trend structure perspective, since the high of $65,588, the market shows a clear downward trend line. This rebound is essentially a technical correction within the downtrend. Only if it stabilizes above $61,560, breaks $62,330, and regains $63,098 can it be qualified to discuss a reversal. Otherwise, it remains a bearish-led rebound.
Lastly, regarding future market trends. The first possibility is that the price holds above $61,560, attacks $62,330, challenges $63,098, and then oscillates in the $63,000 to $63,300 range. This is the healthiest repair path. The second possibility is a volume breakout above $63,098, challenging $64,193, and re-testing the previous high of $65,588, which would indicate that $59,071 is the local bottom. The third possibility is that if it does not break the $61,560 pressure, it falls below $60,609 again, retests $60,000, and seeks the low of $59,071 again. If $59,071 is breached, it would open up new adjustment space.
To summarize, the most critical position in the four-hour chart is $61,560. This will determine whether the current rebound is a simple correction or a reversal. From the shortening MACD green bars and the KDJ golden cross, it appears that short-term bulls are launching a counterattack, with space for upward recovery remaining in the market. As long as $60,600 is held, the focus should be on $62,300 and $63,100. Only a renewed drop below $60,600 would allow bears to regain control. In the short term, it is advisable to look for rebound opportunities, while medium-term observation should focus on whether the $63,000 level can be reclaimed.

It is better to give you a correct approach and trend than a 100% accurate suggestion; teaching someone to fish is better than giving them fish; advice earns for a moment, while learning the approach earns for a lifetime!
Writing time: (2026-06-25, 18:30)
(Written by - Daxian Talks Currency) This is hereby declared: Publishing on the Internet has delays, and the above suggestions are for reference only. Investment carries risks; enter the market with caution!
免责声明:本文章仅代表作者个人观点,不代表本平台的立场和观点。本文章仅供信息分享,不构成对任何人的任何投资建议。用户与作者之间的任何争议,与本平台无关。如网页中刊载的文章或图片涉及侵权,请提供相关的权利证明和身份证明发送邮件到support@aicoin.com,本平台相关工作人员将会进行核查。


