
Author: Coingecko
Translated by: Felix, PANews
As of June 24, the current Bitcoin bear market has lasted for 233 days, making it the fourth longest bear market cycle among seven bear market cycles since 2014. This article defines a "bear market cycle" as the period when the Bitcoin closing price is below its 200-day moving average (200 DMA) for 30 consecutive days or longer.
The moving average is a technical indicator that identifies broader trends by smoothing short-term price fluctuations. The 200-day moving average (200 DMA) specifically tracks the average closing price over the past 200 days and is widely used as a benchmark for assessing the long-term direction of the market.
Overview of Past Bear Market Cycles:
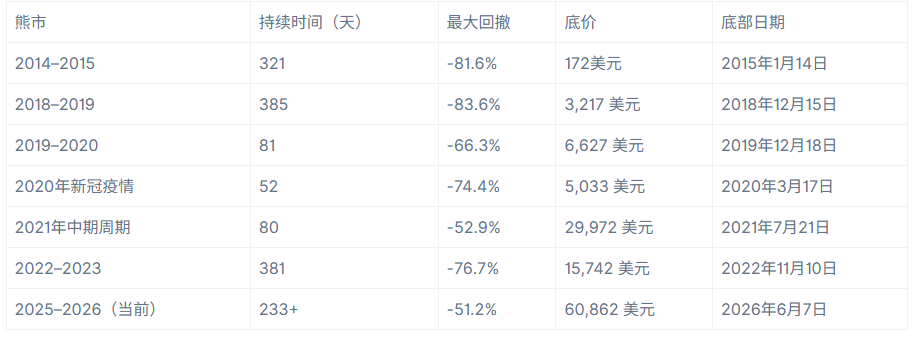
Daily closing price data sourced from CoinGecko, covering January 1, 2014 to June 24, 2026
The two longest bear market cycles in Bitcoin's history are from 2018 to 2019 (385 days) and from 2022 to 2023 (381 days). Both followed structural crashes after reaching new highs, driven by excessive leverage and loss of confidence. The 2018-2019 bear market followed the peak of the ICO boom at the end of 2017 and gradually subsided with the retreat of retail speculation and increased global regulatory scrutiny. The 2022-2023 bear market was triggered by the collapse of the Terra/LUNA ecosystem in May 2022, which subsequently led to the chain bankruptcies of Three Arrows Capital, Celsius, and finally FTX, utterly destroying institutional investors' confidence and dragging Bitcoin below $16,000 in November 2022.
The bear market of 2014-2015 (lasting 321 days) was caused by the collapse of the then-largest Bitcoin exchange, Mt. Gox, which completely destroyed trust in this emerging market.
The remaining four bear markets were of shorter duration and triggered by more isolated shock events. The pullback of 2019-2020 (81 days) and the mid-2021 adjustment (80 days) were relatively brief, with the former being a consolidation phase during a market recovery and the latter caused by a temporary crash in hash power and market sentiment due to China’s mining ban. The "COVID-19 crash" of 2020 (52 days) was the most severe but also bottomed the fastest; this was a macro liquidity shock that was alleviated as global stimulus measures flooded the market.
The current bear market of 2025-2026 (having reached 233 days at the time of analysis) seems to stem from a broader macro shift: rising interest rate uncertainty, the fading upward momentum post-halving, and the rise of AI as a speculative asset class. All these factors have pressured Bitcoin after it reached an all-time high of $124,773 in January 2025.
How Bad Have Previous Bear Markets Been?
The current bear market of 2025-2026 is actually the mildest on record (let's hope so). From the peak of Bitcoin at $124,773, the maximum decline has been 51.2%. Every previous bear market cycle has seen larger declines, with three major bear markets declining between 76.7% and 83.6%.
The closest comparable event is the mid-2021 adjustment (decline of 52.9%), but that event only lasted 80 days and occurred within a broader bull market trend, rather than as an independent bear market cycle.
Historically, the two most destructive cycles are the 2018-2019 bear market (decline of 83.6%) and the 2014-2015 bear market (decline of 81.6%), both of which wiped out most of Bitcoin's previous gains before bottoming out and recovering. The 2022-2023 cycle (decline of 76.7%) was also severe, with Bitcoin dropping from a historical high of $67,617 to a low of $15,742 in November 2022.
Even shorter duration crashes triggered by shocks have resulted in significant losses: the crash caused by the COVID-19 pandemic, although only lasting 52 days, resulted in a 74.4% drawdown, highlighting the rapid deterioration of sentiment and liquidity in the crypto market. The current cycle has avoided such severe damage so far, potentially reflecting a more resilient market structure, higher institutional participation, or simply because the bear market has yet to end.
Is Recovery on the Horizon?
As of June 24, Bitcoin's 200 DMA stands at $76,450, while the spot price is $62,651, a difference of 22%. This means that to reclaim the 200 DMA, it needs to sustain a rebound of more than one-fifth from current levels. Historically, the 200 DMA has played a significant resistance role during the price recovery process, rather than just serving as a support level during declines.
Currently, Bitcoin is approximately 2.9% above the cycle bottom established on June 7, 2026 ($60,861). In previous bear markets, the time taken from confirming the bottom to ultimately reclaiming the 200 DMA has ranged from as short as 65 days (2022-2023 cycle) to as long as 166 days (2014-2015 cycle). If June 7 is indeed the bottom of this bear market (which requires more time to confirm), then even based on the historically fastest recovery speed, reclaiming the 200 DMA would not occur until at least August 2026.
Further reading: Bitwise: Optimistic about Bitcoin's performance in the second half of the year, AI and regulation will spark a new round of altcoin season
免责声明:本文章仅代表作者个人观点,不代表本平台的立场和观点。本文章仅供信息分享,不构成对任何人的任何投资建议。用户与作者之间的任何争议,与本平台无关。如网页中刊载的文章或图片涉及侵权,请提供相关的权利证明和身份证明发送邮件到support@aicoin.com,本平台相关工作人员将会进行核查。


