Written by: Frank, MSX Maitong
In the past month, if we observe the Korean stock market and the US stock market together, we can find a rather interesting phenomenon.
SK Hynix during the Asian trading hours increasingly resembles an advance forecast for the US stock market AI sector that night: If it rises sharply during the day, Nvidia, Micron, and the Philadelphia Semiconductor Index often gap up at night; if it retraces first, US tech stocks are likely to cool down as well.
This linkage is especially intuitive against the backdrop of recent violent fluctuations in global tech stocks.
The latest example occurred this morning after US market hours when Micron (MU) released an explosive earnings report and guidance that greatly exceeded expectations. By the time the Korean market opened, Hynix quickly picked up this storage sentiment, rising more than 10% at one point during trading.
Of course, simply summarizing this phenomenon as "Hynix rises, and US stocks rise" is not rigorous, as a trillion-dollar stock itself is unlikely to determine the multi-trillion-dollar US capital market.
However, when global funds trade around the same set of expectations for AI, a clearer cross-market pricing chain emerges, with Hynix precisely becoming the most sensitive "thermometer" in it.
A question worth discussing thus arises: Why Hynix? How did it become the "Asian market barometer" for global AI trading? As Hynix officially advances its listing in the US, how will Wall Street reprice it?
1. Hynix during the day, US stocks at night—Is it superstition?
From a trading time perspective, the Korean market during the Asian session naturally lies between the previous night's US market close and the next US market open.
This means that when the Korean market opens, investors are already aware of the previous night's US market close and will also trade based on new earnings reports and macro changes that emerge during the day.
Once the Korean market closes, US investors will combine the performance of Asian semiconductor companies with US pre-market trading and index futures as a reference for that day’s risk appetite.
Theoretically, there indeed exists a pricing chain that spans both trading time zones between Hynix and US stocks: The previous night’s US market sets the basic sentiment, Hynix confirms or adjusts it during the Asian session, and the US market subsequently absorbs the incremental information released by the Asian market at the next market open.
To verify this feeling, MSX Maitong backtested the directional correlation, relevance, and conditional hit rate between Hynix and major US indices based on common trading days between the Korean and US markets.
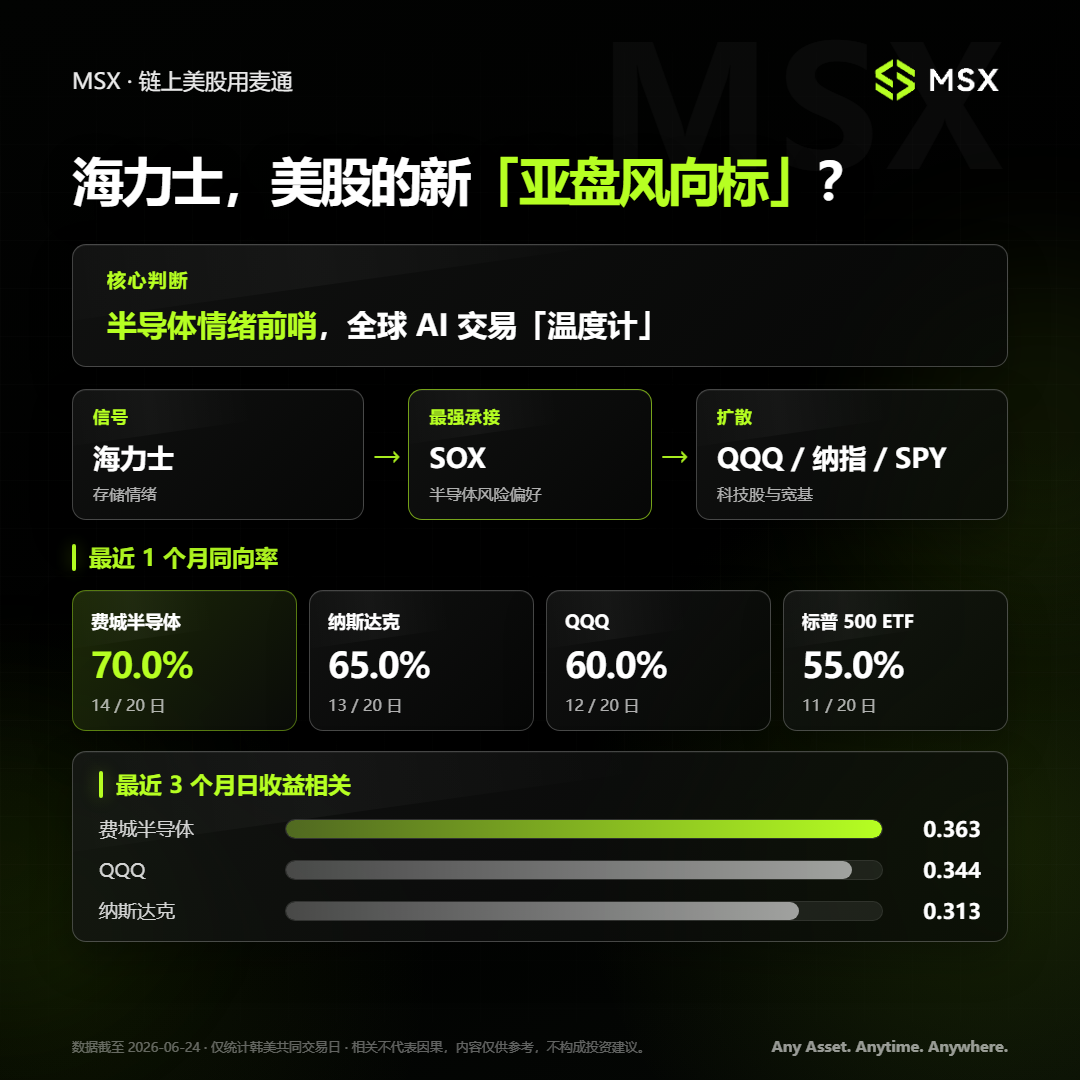
First, regarding the direction of gains and losses over the past month, the directional correlation between Hynix and the Philadelphia Semiconductor Index reached 70%, meaning that in 20 common trading days, the direction was consistent on 14 trading days.
In comparison, the directional correlation between Hynix and the Nasdaq Composite Index was 65%, with QQQ at 60%, and the S&P 500 ETF at 55%.
This result primarily indicates that Hynix is not a broad signal effective for all US stock assets; it shows a very clear industry gradient, for instance, the strongest correlation is with the Philadelphia Semiconductor Index, followed by tech-heavy Nasdaq and QQQ, and finally extending to the S&P 500, which represents the overall US market.
This aligns closely with Hynix's industry attributes.
Funds primarily trade Hynix to gauge the prosperity of storage and semiconductor sectors, and subsequently, this risk appetite transmits to the entire AI tech sector. Only when the market is strong enough and the influence broad enough will it further spread to the US stock market.
In other words, Hynix acts more like a semiconductor sentiment sentinel rather than a macro indicator of the US stock market.
Looking at the daily return correlations over the last three months, this industry gradient also exists. The correlation coefficient between Hynix and the Philadelphia Semiconductor Index is 0.363, 0.344 with QQQ, and 0.313 with the Nasdaq Composite Index.
It is important to emphasize that these numbers do not mean that a 1% increase in Hynix will mechanically lead to a 0.363% increase in the Philadelphia Semiconductor Index, but rather measure the extent of simultaneous movement in both return groups during the sample period—values closer to 1 indicate greater ease of simultaneous rise or fall; values closer to 0 indicate a weaker linear relationship.
Realistically, a correlation of 0.3 to 0.4 is merely moderately positive, but considering the noise present in daily financial markets, this is already a very high and valuable signal.
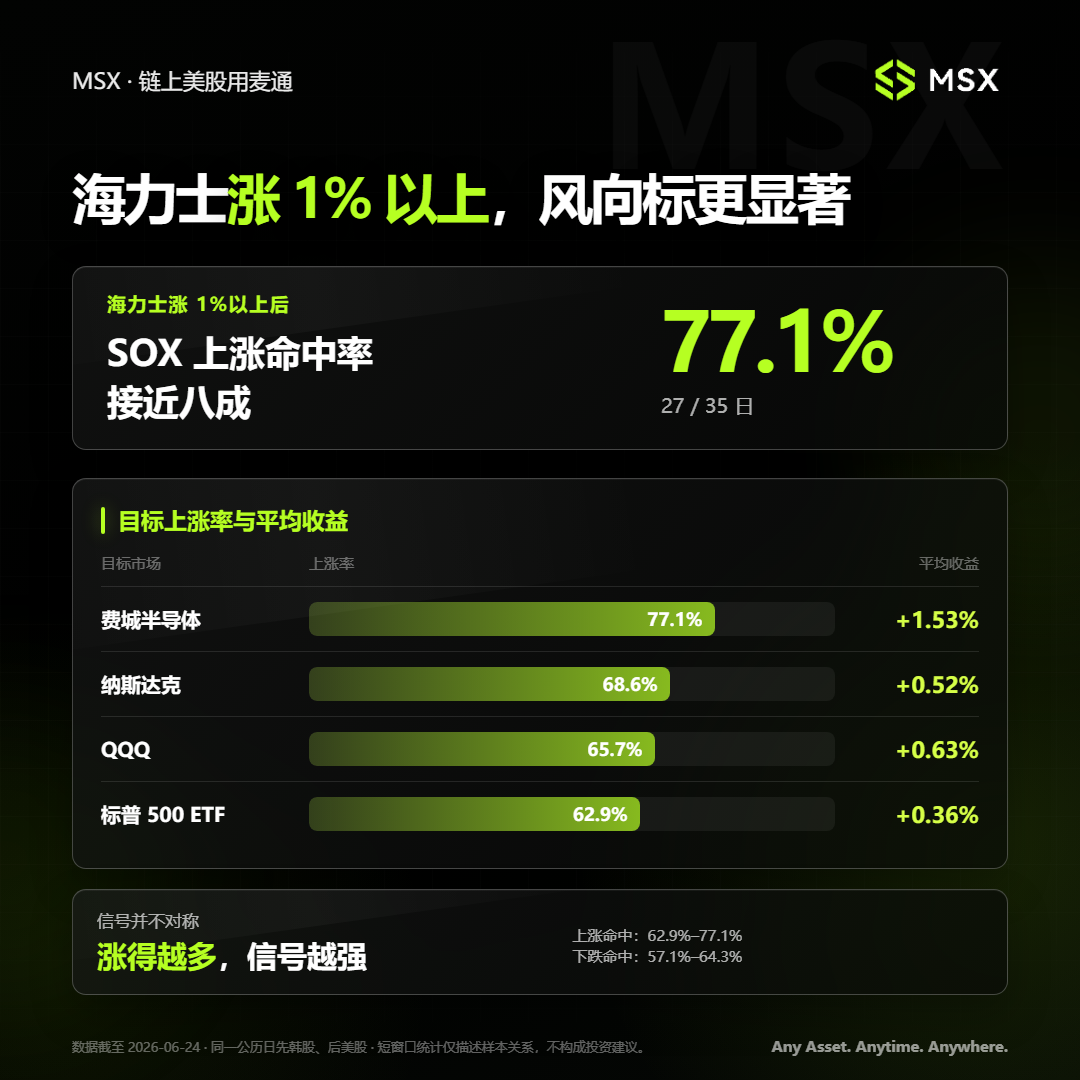
For this reason, MSX further cleaned and screened the sample, discovering a distinct "strong volatility trigger" feature—when Hynix rises more than 1% in a single day, the hit rate for the Philadelphia Semiconductor Index to rise that evening reaches 77.1%, meaning that out of 35 qualifying samples, 27 recorded a rise, with an average return of 1.53%.
Under the same conditions:
- The Nasdaq Composite Index has a rise hit rate of 68.6%, with an average return of 0.52%;
- QQQ has a rise hit rate of 65.7%, with an average return of 0.63%;
- The S&P 500 ETF has a rise hit rate of 62.9%, with an average return of 0.36%;
This set of results is undoubtedly more explanatory than a simple directional correlation.
After all, when Hynix displays only minor fluctuations, there may be a lot of noise from local funds in Korea, exchange rates, and index weight adjustments involved, but when it rises more than 1% in a single day, it often signifies that the market is concentrating on trading clearer industry information.
Interestingly, this signal is not entirely symmetrical. In this sample, after Hynix shows a significant rise, the rise hit rate of major US indices roughly falls between 62.9% and 77.1%; whereas, when Hynix experiences a significant drop, the corresponding drop hit rate for US stocks is only about 57.1% to 64.3%.
This means that, at least during the current sample period, the rise signal from Hynix is temporarily more stable than the fall signal.
This could be related to the fact that the sample period falls within the upturn phase of AI storage prosperity; in a market where funds tend to seek long positions in AI, a substantial rise in Hynix is more easily understood as a confirmation of renewed industry demand, similar to the direct catalyst of Micron's earnings report today.
Conversely, Hynix’s decline may stem from short-term profit-taking, technical corrections in the Korean market, or fluctuations at the stock level, which do not necessarily indicate a synchronized deterioration of the global AI fundamentals.
The third set of data further reveals the specific points in time when the Hynix signal plays a role.
If we break down the daily returns of the US stock market into two parts:
- Opening gap: The change in the day’s opening price relative to the previous trading day's closing price;
- Intraday returns after opening: The change in the day’s closing price relative to the opening price;
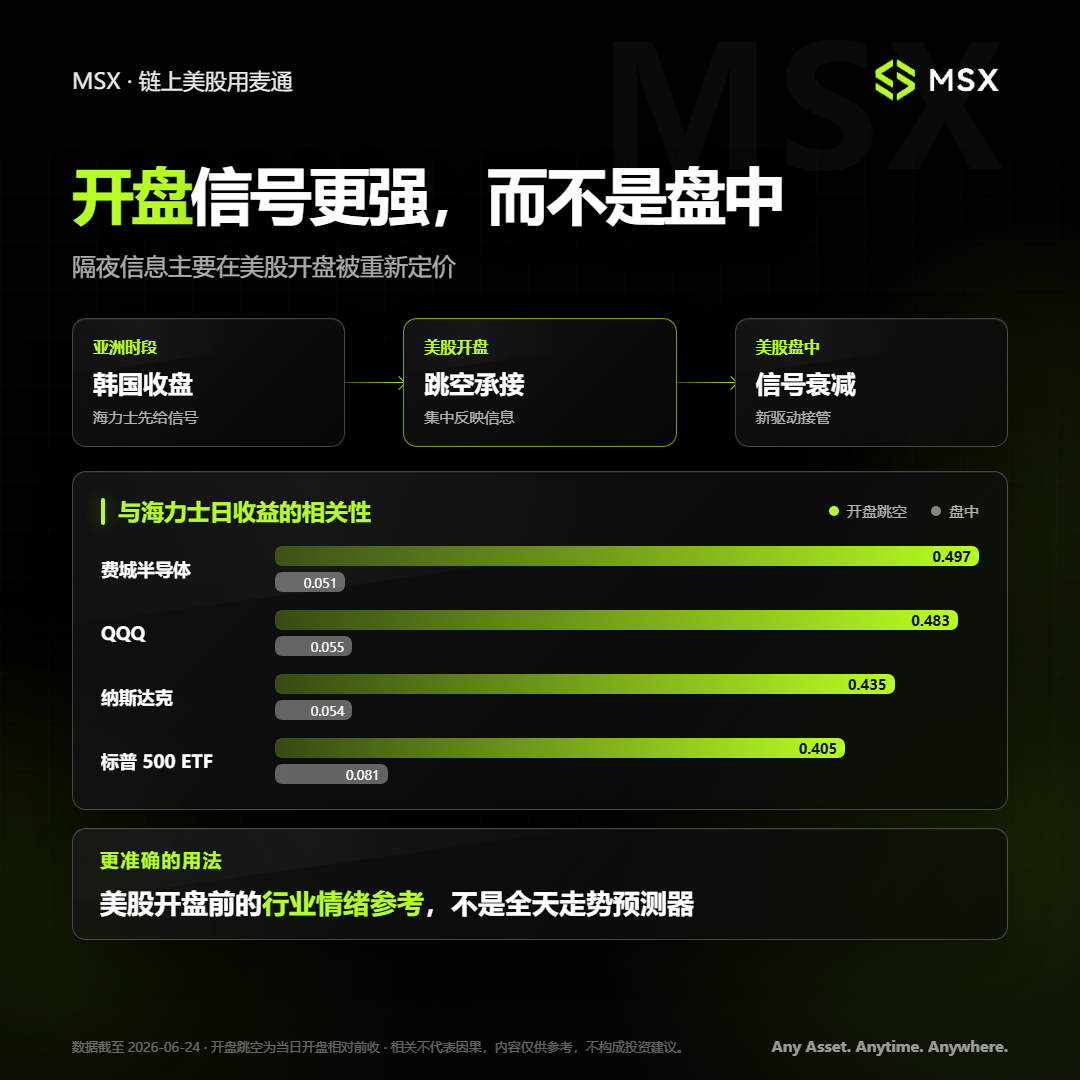
We find that the correlation between Hynix and US stocks is almost concentrated in the opening gap phase.
Specifically, the daily return of Hynix and the opening gap of the Philadelphia Semiconductor Index have a correlation coefficient of 0.497, with QQQ at 0.483, the Nasdaq Composite Index at 0.435, and the S&P 500 ETF at 0.405.
As mentioned earlier, a correlation coefficient close to 0.5 in the noisy daily cross-market returns means that the stronger Hynix performs during the day, the easier it is for the Philadelphia Semiconductor Index and QQQ to open high that evening; conversely, when Hynix performs poorly, US semiconductor and tech stocks are also more likely to open low.
However, once the US stock market really opens, this connection almost rapidly disappears. The correlation between Hynix’s daily returns and the intraday returns of the Philadelphia Semiconductor Index is only 0.051, 0.055 with QQQ, 0.054 with the Nasdaq Composite Index, and 0.081 with the S&P 500 ETF, which is basically close to zero.
This huge contrast between the two phases indicates that the information disclosed by Hynix during the Asian session is primarily absorbed by the US market in the opening price; once the US market opens, US domestic data, news, and intraday liquidity take over pricing, and Hynix’s explanatory power quickly diminishes.
Combining the three groups of data, we derive a relatively complete transmission chain:
Hynix first confirms storage and semiconductor sentiment, SOX directly assumes it when the US market opens, and the influence then spreads to QQQ and Nasdaq, only then potentially reaching the S&P 500. In this, SOX verifies the signal's industry attributes, while QQQ and the Nasdaq observe whether it has diffused to the mainline AI stocks in the US market, and the S&P 500 serves as a benchmark for the broad market.
From this perspective, the linkage between Hynix and the US AI sector does not mean that the former unilaterally "drives" the latter, but rather that both markets continuously price the same set of industry variables in different time frames.
Hynix benefits from being the first to open and has gained an informational lead due to its core position in the AI storage supply chain, which provides stronger information concentration than typical Asian tech stocks.
This also leads us to a more critical layer of questioning: why is it Hynix that can undertake this role?
2. Why is it Hynix specifically?
The fundamental reason Hynix has achieved this market position is not merely because the Korean market opens earlier but because it has indeed become an unmissable "key minority" in AI infrastructure.
As is known, in recent years, discussions about AI in the market often first think of GPUs.
Nvidia provides computing power, cloud vendors build data centers, power, networking, optical communication, and liquid cooling ensure the stable operation of computing clusters; in this narrative, although storage is equally important, it has long been considered a relatively traditional cyclical component.
However, as model scale, training data, and inference demand continue to grow, the challenges faced by AI systems are no longer just "is there enough GPU," thus the role of storage in AI is being redefined:
- HBM is closely aligned with GPUs, responsible for high-speed data transport, determining whether the expensive AI chips can fully unleash computing power;
- Server DRAM handles operational memory, affecting server concurrency capacity and task throughput;
- NAND is responsible for long-term storage of models, training data, and inference data, absorbing the overall data growth brought by AI;
- Enterprise-grade SSDs are located in data center storage layers, speeding up data entry into computing systems with higher capacity and faster read speeds;
To put it more bluntly, GPUs determine "whether it can compute," HBM determines "whether computing power can be fully unleashed," DRAM determines "how many tasks can be processed simultaneously," and NAND and enterprise-grade SSDs determine "where massive amounts of data are stored and how quickly it can be accessed."
And Hynix almost spans every level of this AI storage chain, achieving a "grand slam."
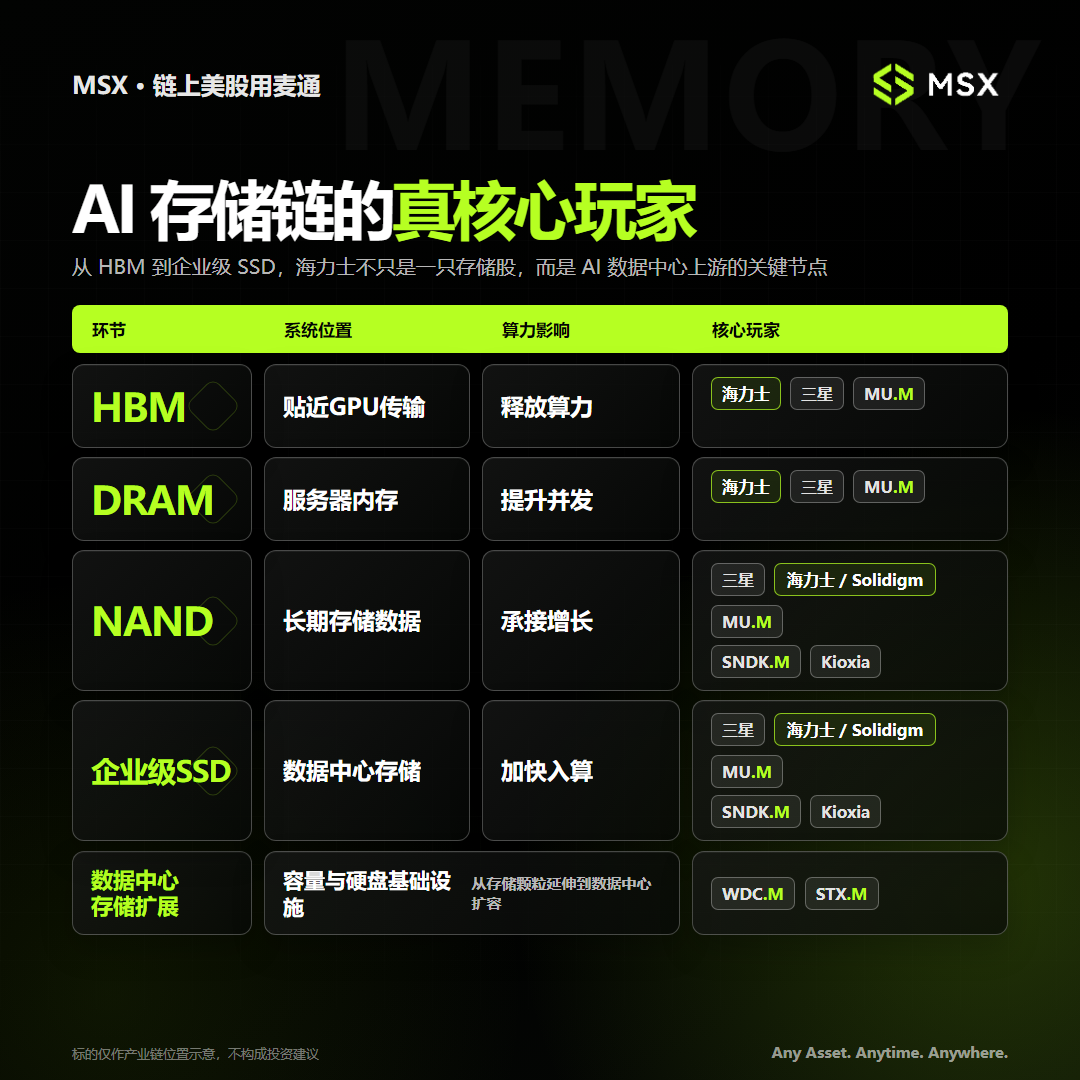
In the HBM domain, Hynix remains one of the most critical global suppliers. As of the first quarter of 2026, Hynix holds approximately 58% of the global HBM market, with Samsung and Micron each accounting for about 21%. It is also one of Nvidia's most important HBM suppliers for AI accelerators.
Moreover, the biggest difference between HBM and traditional standardized storage is that it cannot be easily replaced by customers.
At the same time, Hynix is not just an HBM company. As early as 2020, it announced the acquisition of Intel's NAND and SSD business for about 9 billion dollars, completing the first phase of the transaction in 2021 and establishing Solidigm, focusing on enterprise-grade SSDs and data center storage in the U.S.; in March 2025, both parties completed the second phase of the deal, officially transferring Intel's remaining NAND technology, intellectual property, and related personnel, finally concluding this multi-year acquisition.
This transaction not only filled Hynix's critical capabilities in the enterprise storage field but also provided it with two interconnected but not entirely identical growth curves:
- One revolves around HBM and server DRAM, participating in AI accelerators and server expansions;
- The other revolves around NAND and enterprise SSDs, meeting the needs for training data, model weights, inference caching, and data center storage;
Ultimately, today's Hynix resembles a highly pure AI storage asset, with profits, capital expenditures, and market expectations closely tied to the prosperity of storage.
This concentration of business undoubtedly maximizes its stock price elasticity, thereby forming a closed loop of the three conditions for Hynix to become the Asian market barometer:
- First, it opens earlier in time, able to digest information occurring during the Asian session ahead of the US;
- Second, it is sufficiently core in the industry, spanning the four layers of the storage chain: HBM, DRAM, NAND, and enterprise SSD;
- Third, it has high business purity and stock price elasticity, enabling a rapid amplification of global funds' judgments regarding the prosperity of AI storage;
Thus, when Hynix experiences significant fluctuations, the market is trading not merely the rise or fall of a specific Korean company, but rather questioning whether AI servers can continue to scale, whether storage supply remains tight, and whether global funds are willing to pay higher valuations for AI hardware.
The issue is that Hynix's previous identity in the Korean market's capital realm has not fully kept pace with its changes in global industrial status.
The latest advancement of its US listing is attempting to change that.
3. The US Listing: Changing More Than Just the Trading Venue
Coincidentally, on June 24, Hynix publicly submitted F-1 registration documents to the US Securities and Exchange Commission (SEC), formally promoting its NASDAQ ADR listing, with plans to use the ticker symbol "SKHY."
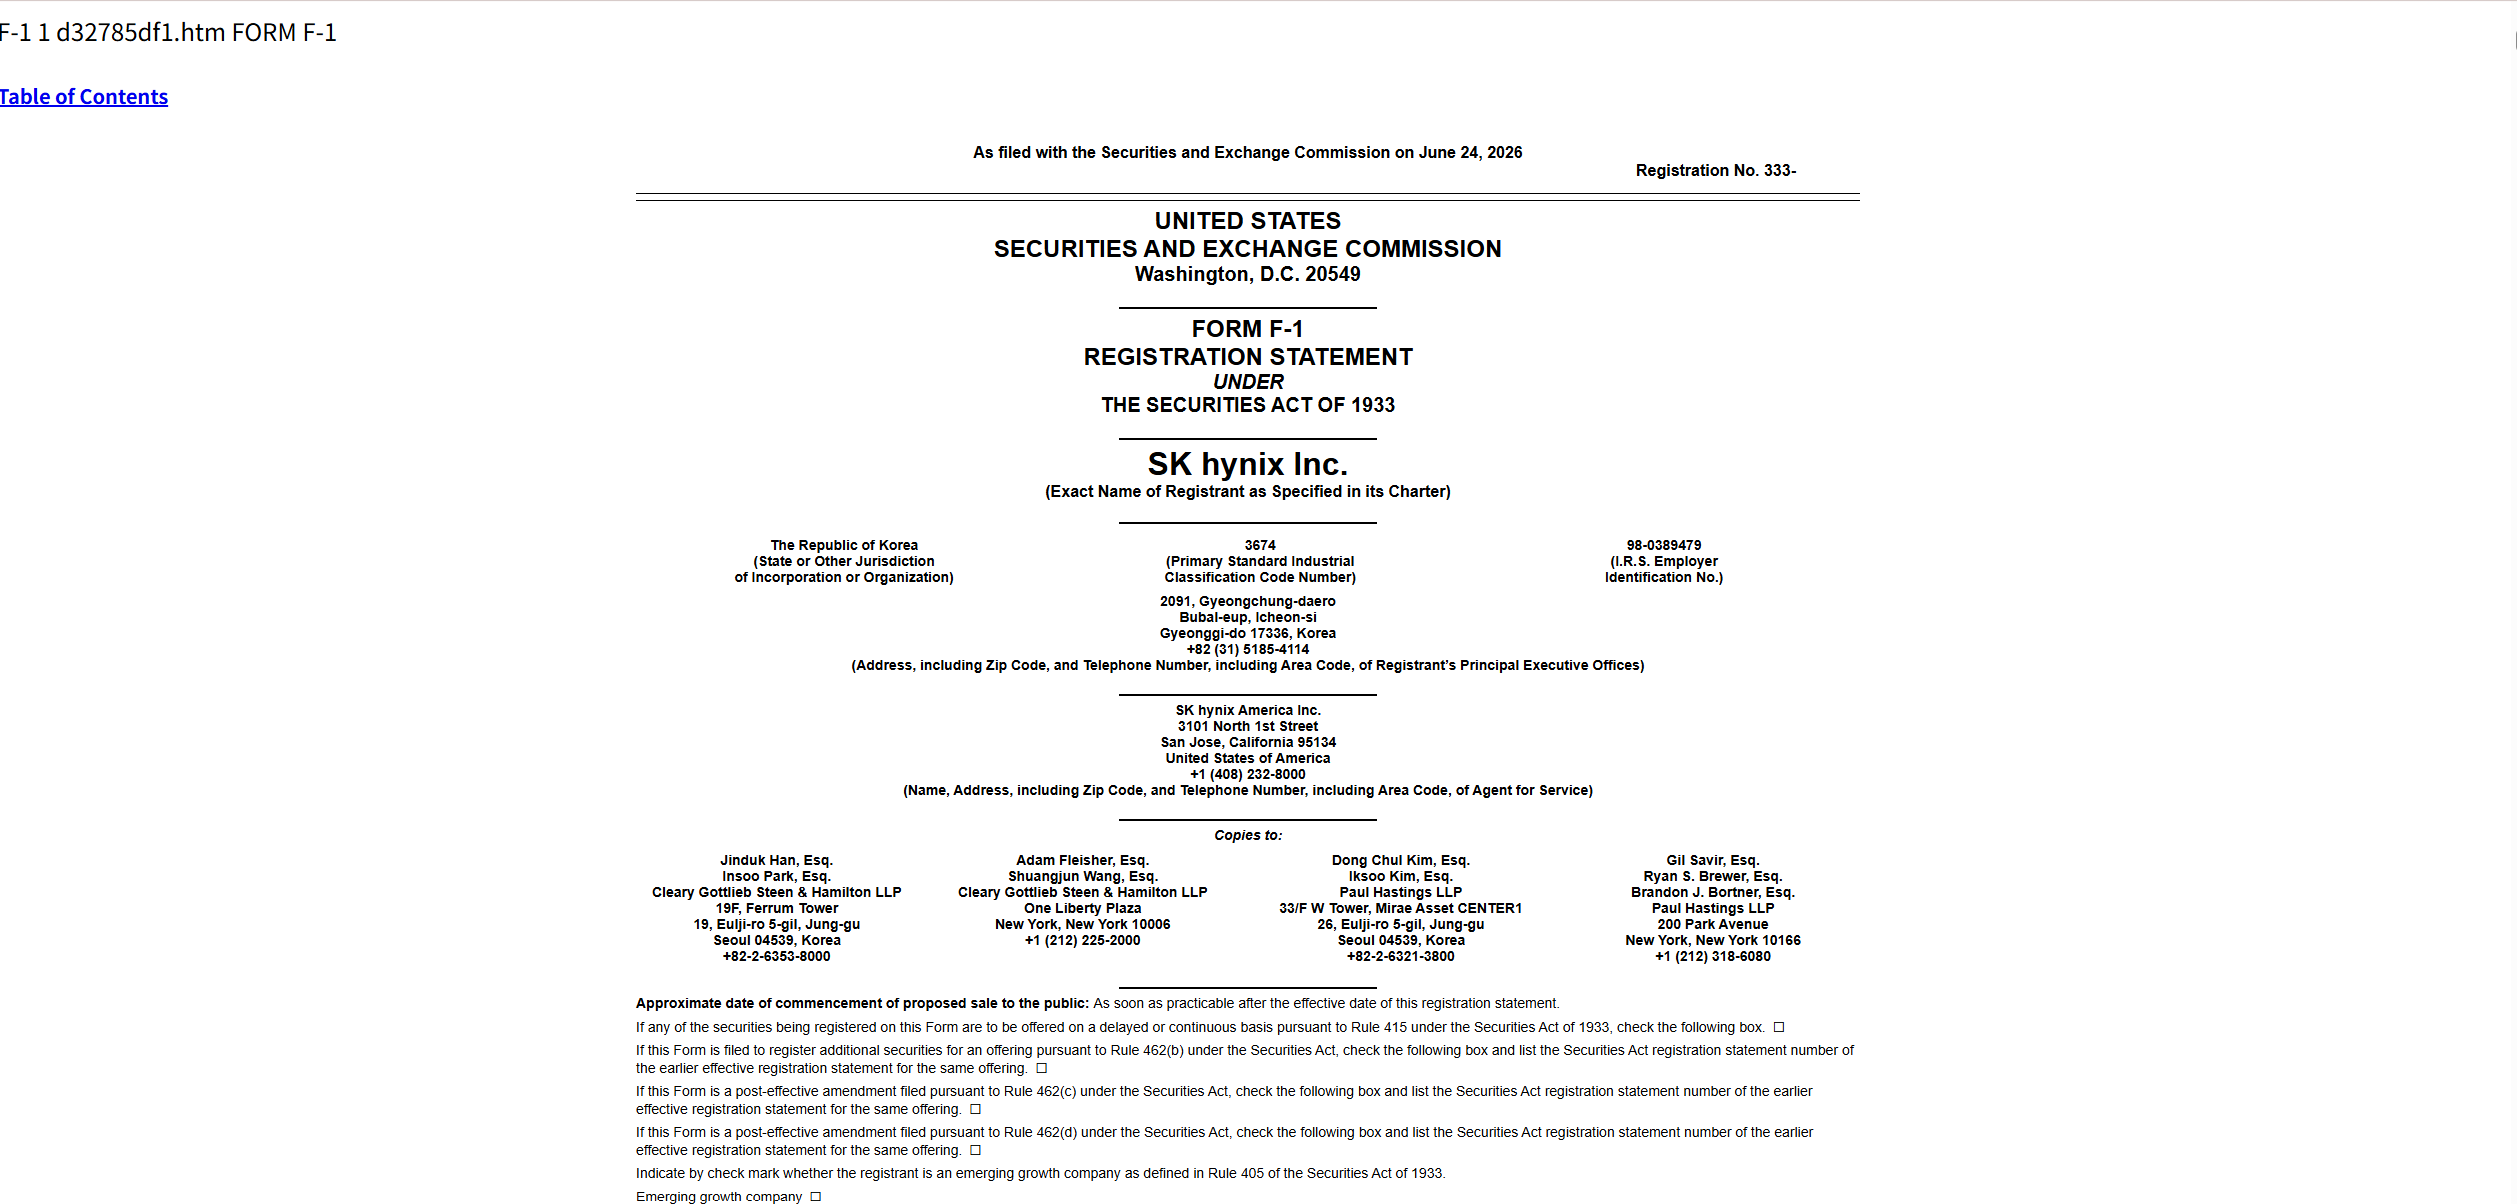
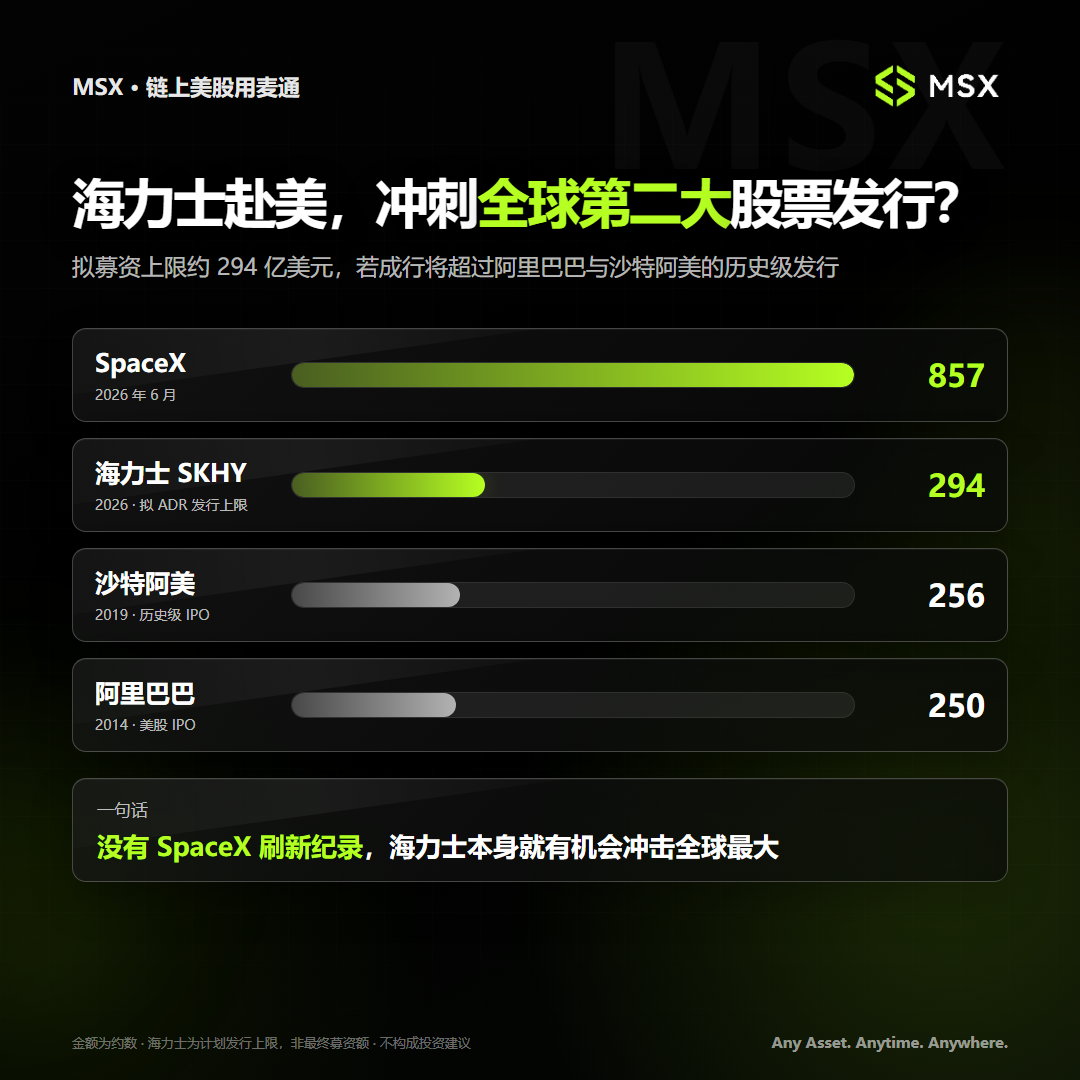
According to the currently disclosed plan, Hynix aims to issue up to 17.79 million new ordinary shares, with a potential fundraising scale of up to approximately 29.4 billion dollars, planning to debut on NASDAQ as early as July 10.
If it completes the issuance at the current indicative price, this would become one of the largest stock offerings in the history of global capital markets—surpassing Alibaba's 25.6 billion dollars in 2014 and Saudi Aramco's 25.6 billion dollars in 2019, second only to the 85.7 billion dollar record set by SpaceX in mid-June.
In other words, if SpaceX hadn’t preemptively broken the record in June, Hynix itself had the chance to rank as the largest stock issuance globally.
It should be noted that Hynix’s US listing is not a traditional IPO from a company that has never been listed but rather a secondary listing and new stock issuance via ADR for a company already listed in Korea.
Theoretically, simply changing a trading venue does not inherently create new revenue or profit, and aside from raising funds, the business itself seems unlikely to change immediately.
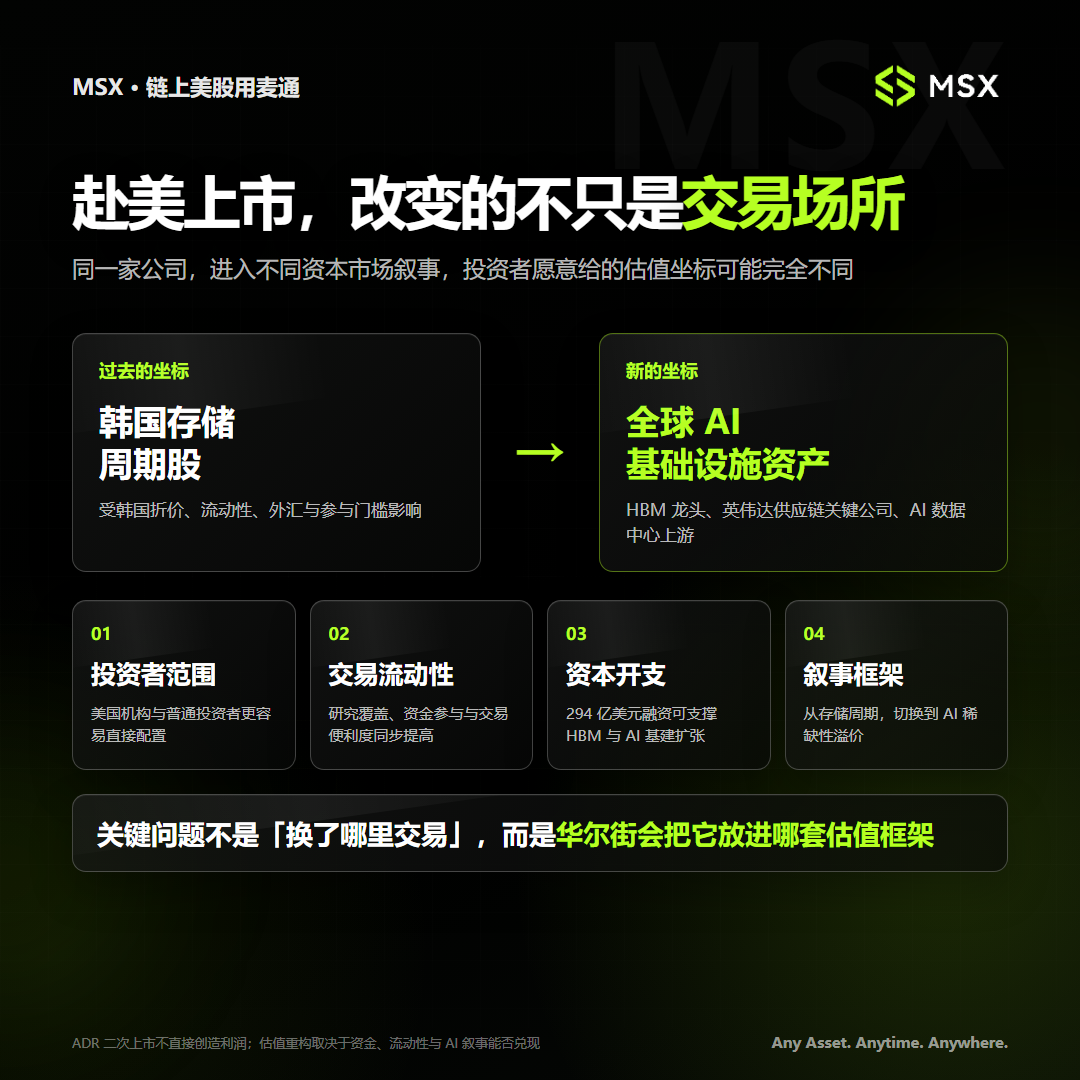
However, what capital markets truly price is never just current profits; what a US listing may genuinely alter is its range of investors, liquidity, capacity for capital expenditures, and the narrative framework the market assigns to it.
The most direct change is that Hynix may undergo a transformation in positioning from "Korean storage cyclical stock" to "global AI infrastructure asset."
For a long time, many large Korean companies, including Hynix, have been affected by what is known as the "Korean discount." The complex group governance structure, foreign exchange risk, market liquidity, and barriers to international capital participation make it difficult for Korean companies to gain valuations comparable to their American peers, even if they possess global competitiveness.
Objectively speaking, it’s not just Korea; indeed, compared to US stocks, all other markets are similarly positioned. Thus, once Hynix enters the US capital market, it may be placed in a different set of coordinates—it is a key company in the Nvidia AI supply chain, a leader in the HBM market, an indispensable infrastructure supplier for AI data centers, and it also possesses Solidigm and domestic AI business platforms.
The same company, when placed into different capital market narratives, may receive completely different valuation multiples from investors.
The second change is that listing on US stocks will significantly lower the threshold for investors to directly allocate to Hynix.
Some US institutions have previously been restricted by trading rules, preferring to purchase securities listed on the US market; ordinary investors also needed to hold Hynix indirectly through the Korean market or regional ETFs. Therefore, once it lists in the US, the participation of incremental funds and trading liquidity will undoubtedly improve significantly.
More importantly, Hynix will be directly comparable to Micron in the same trading market for the first time, this may also divert some funds away from Micron, especially for funds that can only allocate to a limited number of AI storage assets; Hynix's listing undoubtedly provides a new option, one that seems more advantageous in terms of HBM share, supply chain position, and industry scarcity.
Of course, the current AI bull market can extend cycles but cannot eliminate them entirely; thus, after the US listing, how Wall Street ultimately perceives Hynix will still depend on whether it can answer several key questions:
- First, can Hynix continue to maintain its lead in next-generation products such as HBM4, HBM4E, rather than quickly losing market share as Samsung and Micron catch up?
- Second, is the high profit margin brought about by HBM merely a temporary supply bonus, or can it translate into long-term customer stickiness and profitability?
- Third, can Solidigm and enterprise-grade SSDs genuinely meet the growth in AI data, becoming a second growth curve outside of HBM?
- Fourth, can the US AI business platform assist Hynix in evolving from a chip supplier to a provider of AI data center solutions?
- Fifth, will the capacity expansion resulting from the 29.4 billion dollars in financing consolidate its market position, or accelerate the next round of supply-demand reversal in the entire storage industry?
This is also a variable worthy of long-term tracking.
Final Thoughts
Returning to the initial question, does Hynix’s rise during the Asian market truly indicate that the US stock market will rise in the evening?
The answer may not be that absolute.
Hynix cannot independently determine the direction of the US stock market; it is equally affected by the preceding night’s US market performance, the global macro environment, and market risk sentiment, making it difficult to simplify the correlation into a one-way causality.
However, it is undeniable that Hynix is becoming an increasingly worthy cross-market signal—as global funds trade around the same set of AI expectations, it is becoming the earliest open and most sensitive "thermometer."
The reason it can undertake this role is clear: as AI trading expands from a pure chase for GPUs to include storage, packaging, optical communication, power, and data centers, companies that represent key industry bottlenecks will also gain stronger price influence.
Hynix happens to occupy the most central position in this regard, being one of the rare "key minorities."
Thus, Hynix is more like a mirror. The Korean market during the day first reflects the global funds' judgment on AI demand, storage supply, and tech stock risk appetite; by night, the US market completes the next round of pricing around the same set of variables.
This also gives rise to a new expectation in the market: Can Hynix, once "trapped in shallow waters," further escape the valuation framework of traditional cyclical stocks and become, in Wall Street's eyes, the next true AI infrastructure asset?
This is also the answer the market eagerly awaits before Hynix’s listing in the US.
免责声明:本文章仅代表作者个人观点,不代表本平台的立场和观点。本文章仅供信息分享,不构成对任何人的任何投资建议。用户与作者之间的任何争议,与本平台无关。如网页中刊载的文章或图片涉及侵权,请提供相关的权利证明和身份证明发送邮件到support@aicoin.com,本平台相关工作人员将会进行核查。


