This article is merely a personal market opinion and does not constitute investment advice. Any actions taken based on this are at your own risk regarding profits and losses.
The content of this article can be set for paid reading. However, considering that I just published a lengthy paid article on June 14, the time span is too close, and I do not wish for my longtime readers to pay repeatedly within the same market situation.
Therefore, this article will not be paid, serving as a periodic free update, and as a return for long-term readers.
However, free does not mean that this content is unimportant. On the contrary, the current market has entered a critical verification phase, so expectations and plans for future trends are particularly important.
This article mainly addresses the following questions:
1. How will the subsequent market unfold? — I personally lean towards a short-term rebound first, followed by a correction.
2. From a hexagram perspective, the market trend in July differs from June's sharp decline and leans towards a gradual decline.
Some subsequent short-term views can be followed through X (Chengchao) or the free Telegram channel (https://t.me/+9XshXu-VjMMwMTJl).
To conclude, since May, it has already fallen by almost 30%. The short-term decline has been significant, coupled with the buying power still existing around 59,000, and the macro level has not deteriorated further. Thus, I lean towards a short-term rebound first, then another decline.
For confirmation signals, one can pay attention to the 2-hour level downward trend line; if it breaks, it increases the likelihood of a rebound.
1. Market Review
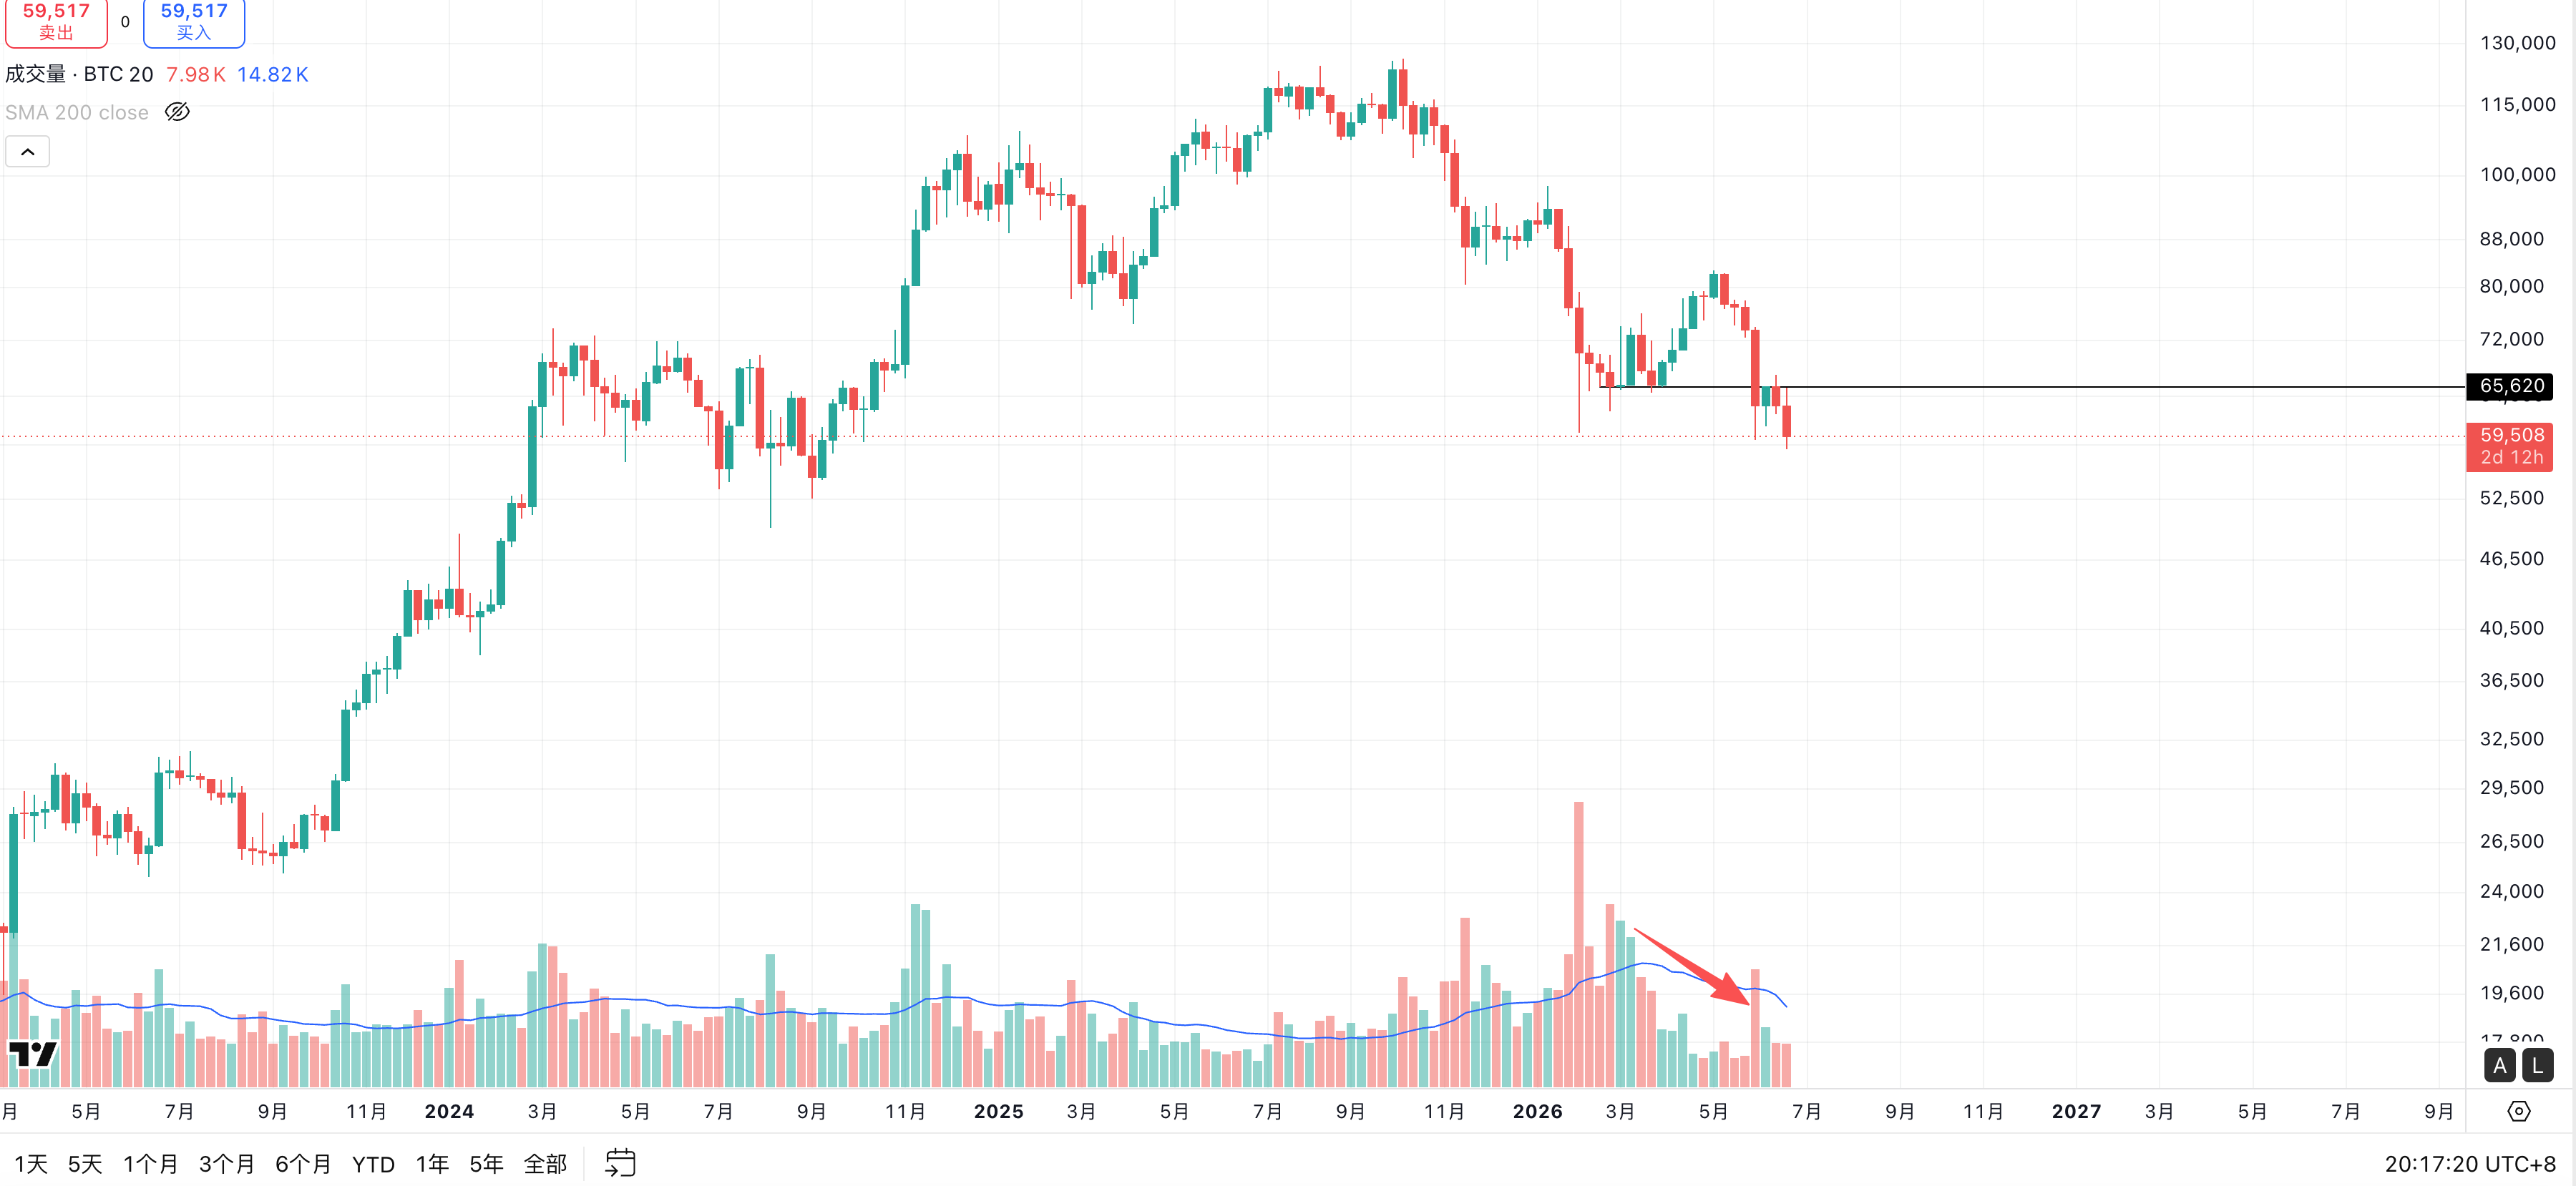
First, look at the weekly K-line chart; during the nearly four-month oscillation process after the bottom in early February (65,000-82,000), trading volume continued to shrink.
Then, during the week of June 1, it broke through the weekly support line with increased volume and subsequently rebounded for the next two weeks. This pattern and volume combination is a very standard oscillation + breakout + volume pullback combination.
Therefore, from a weekly perspective, as long as the close does not return above 66,000, one cannot say the decline has ended.
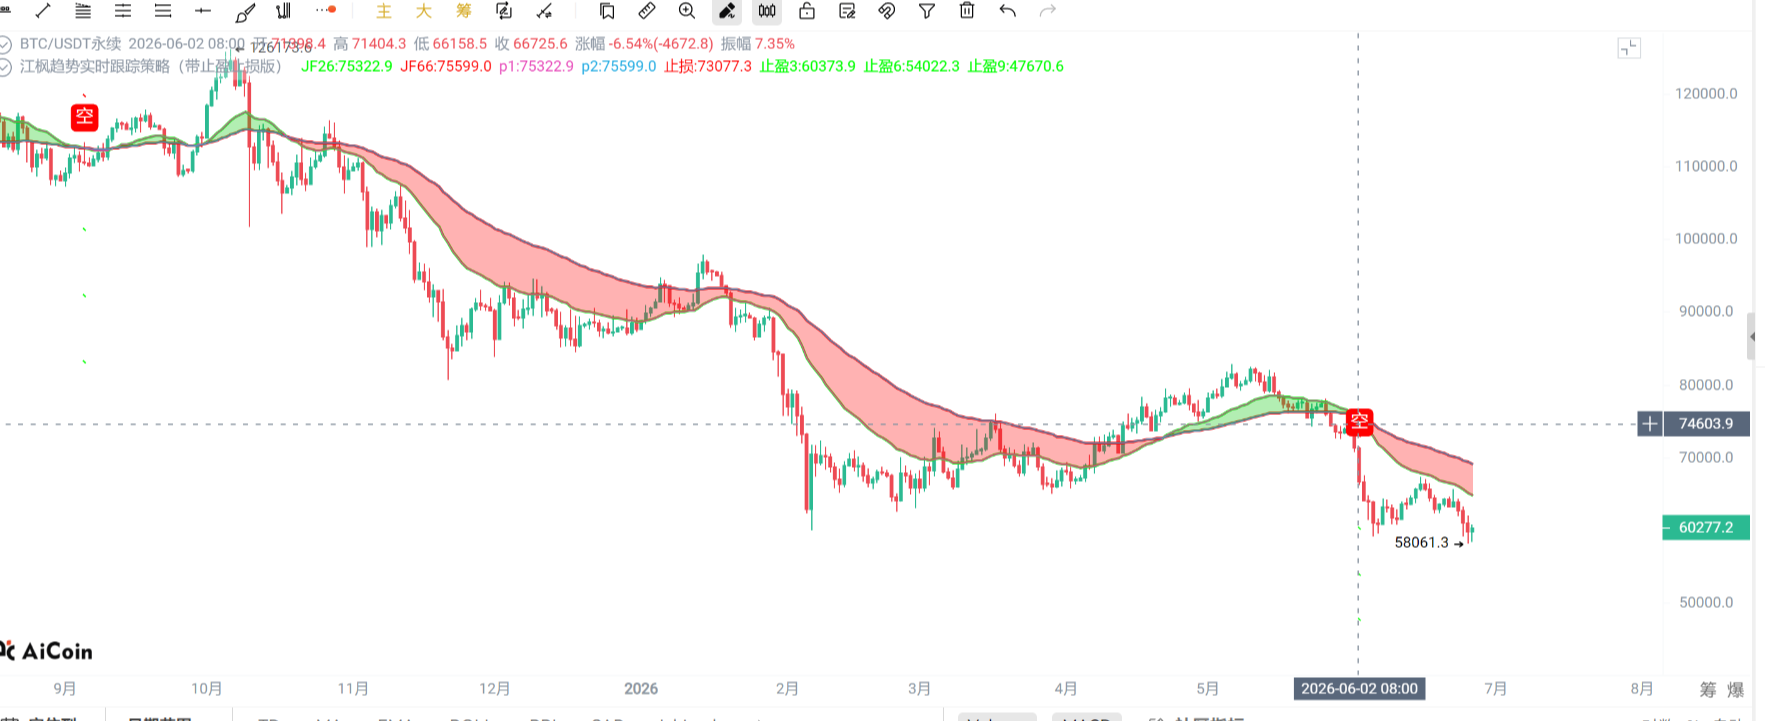
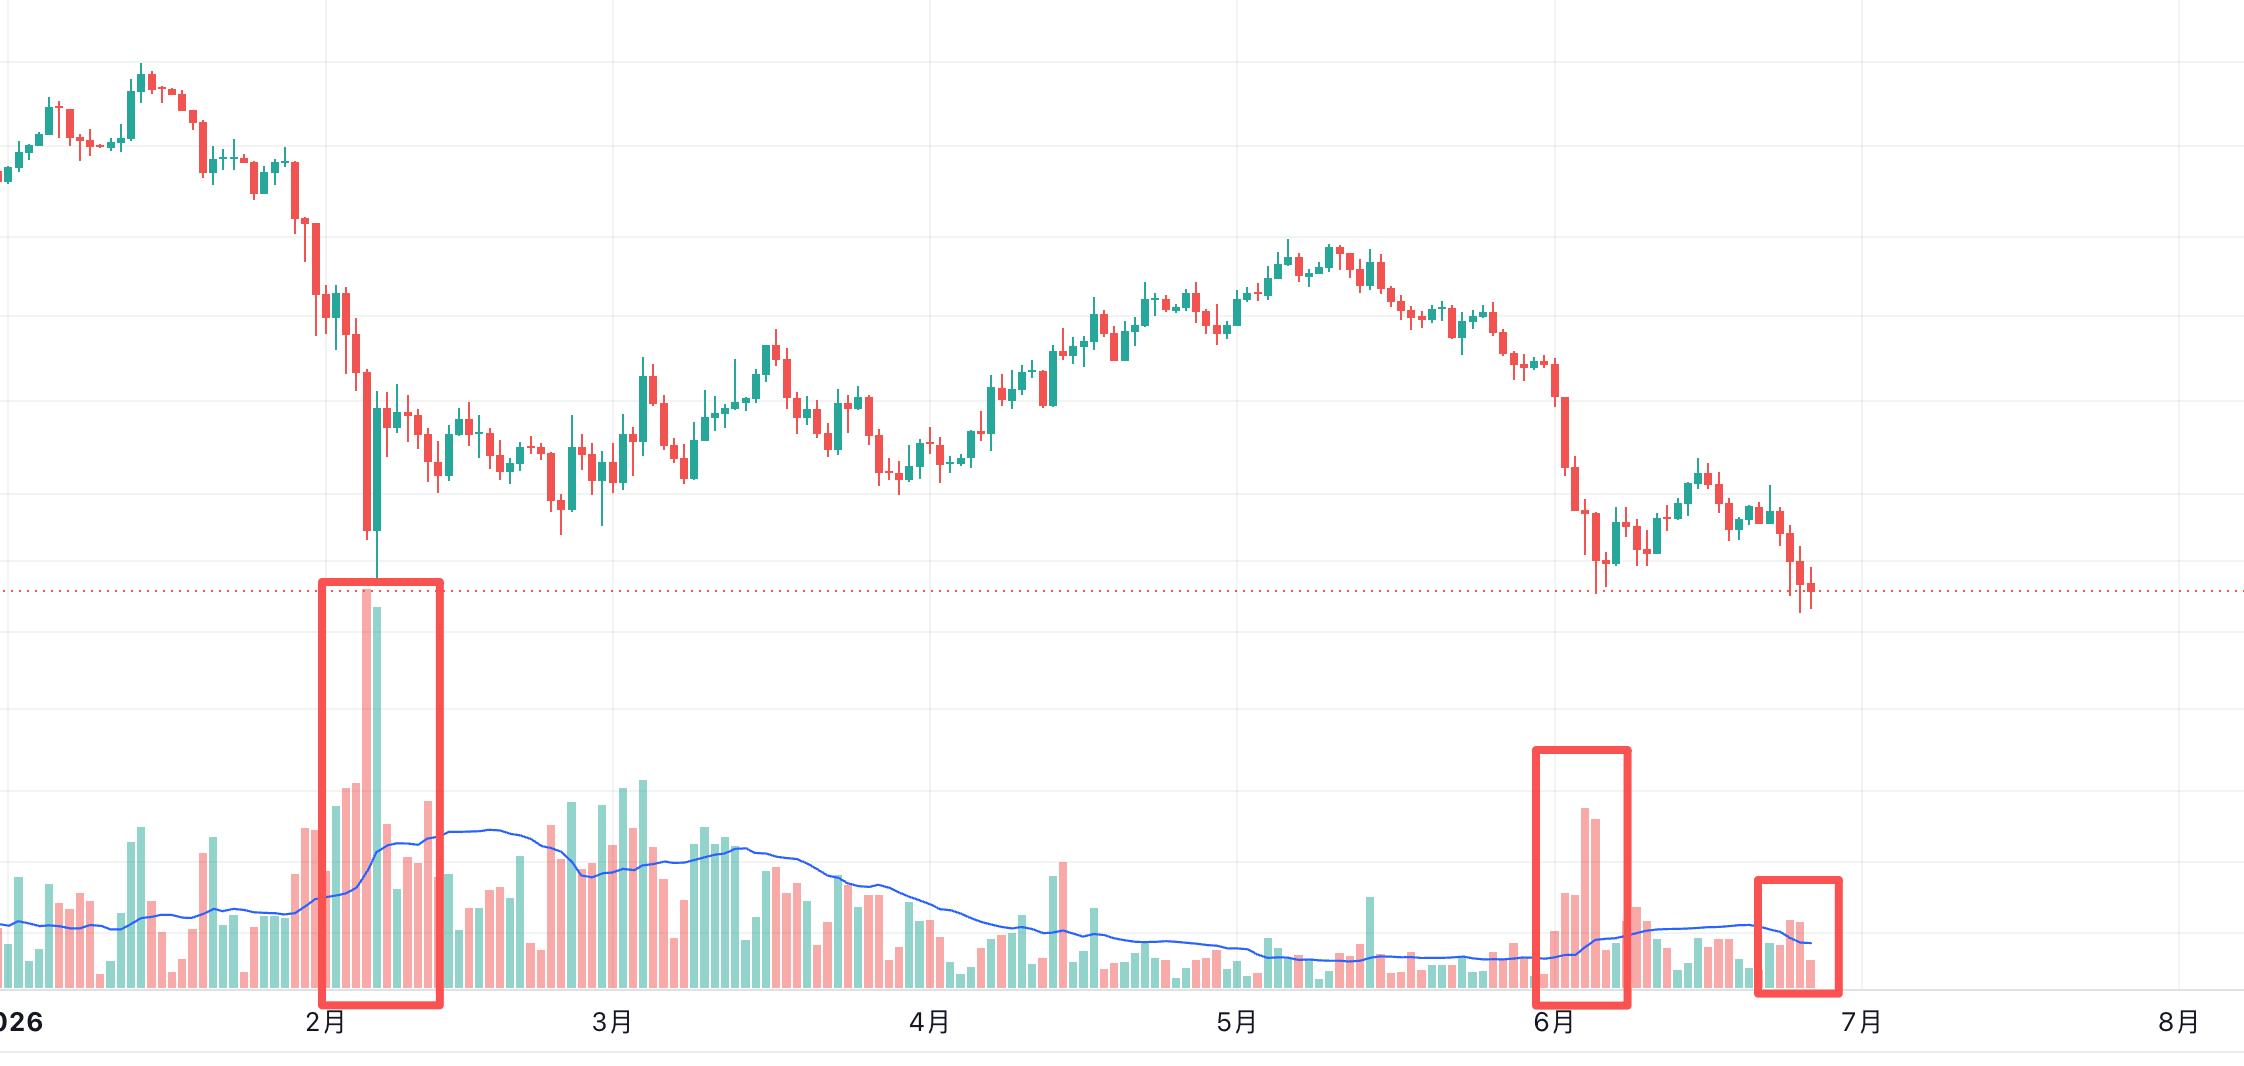
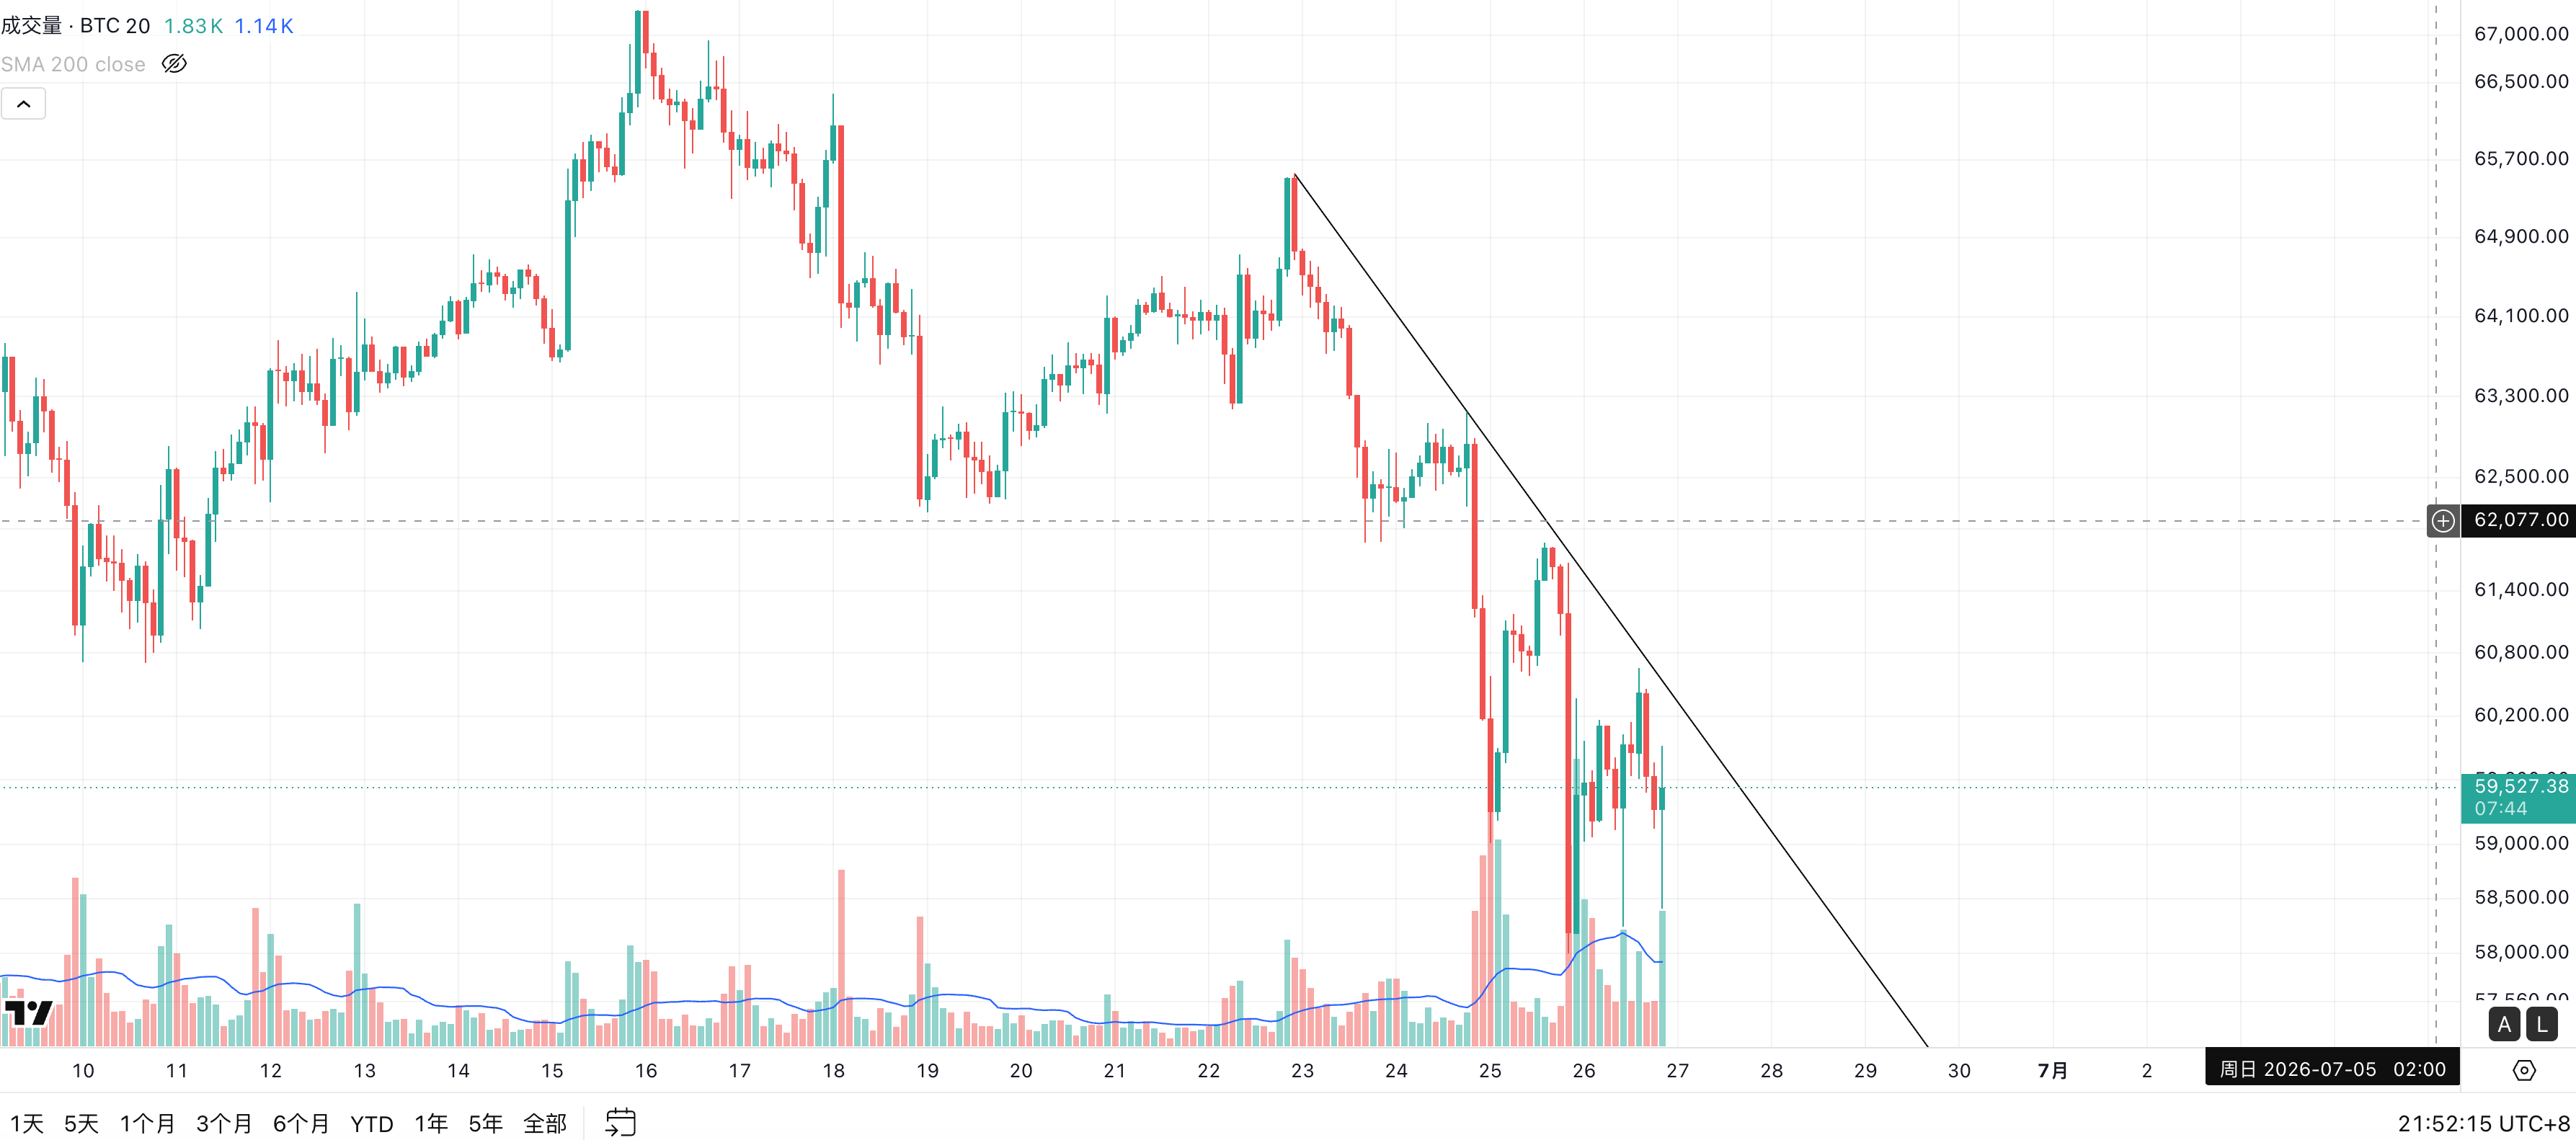
Looking at the daily level trend in the chart below, the three red boxes correspond to the trading volumes at the lows in early February, early June, and around June 24.
The massive trading volume in early February corresponded to a peak phase of selling, followed by nearly three months of oscillation rebound, opening a new round of decline in early May.
In early June, it again experienced a significant drop below 60,000, with the trading volume being three times the 20-day moving average volume, still massive. Afterward, it rebounded for 10 days.
On June 24, it once again saw significant volume dropping below 60,000, and the trading volume was significantly reduced compared to the previous two times, yet its absolute value was still not small, about 1.5 times the 20-day moving average volume. The price slightly set a new low.
Now the question arises: was the trading volume near this week's low significant or not? Is there a possibility that this is the third retest of the bottom?
My answer is that although the volume has decreased relative to the previous two times, its absolute value is still relatively large, with both buyers and sellers exerting power here. The absence of continued decline merely indicates that buyers have temporarily absorbed the selling pressure but does not prove that the selling pressure has dissipated.
In a normal market development, there will continually be selling pressure testing the market's purchasing ability until the main players cannot obtain more chips at a lower price, leading to higher lows, finally turning into an upward trend.
2. How will the subsequent market unfold?
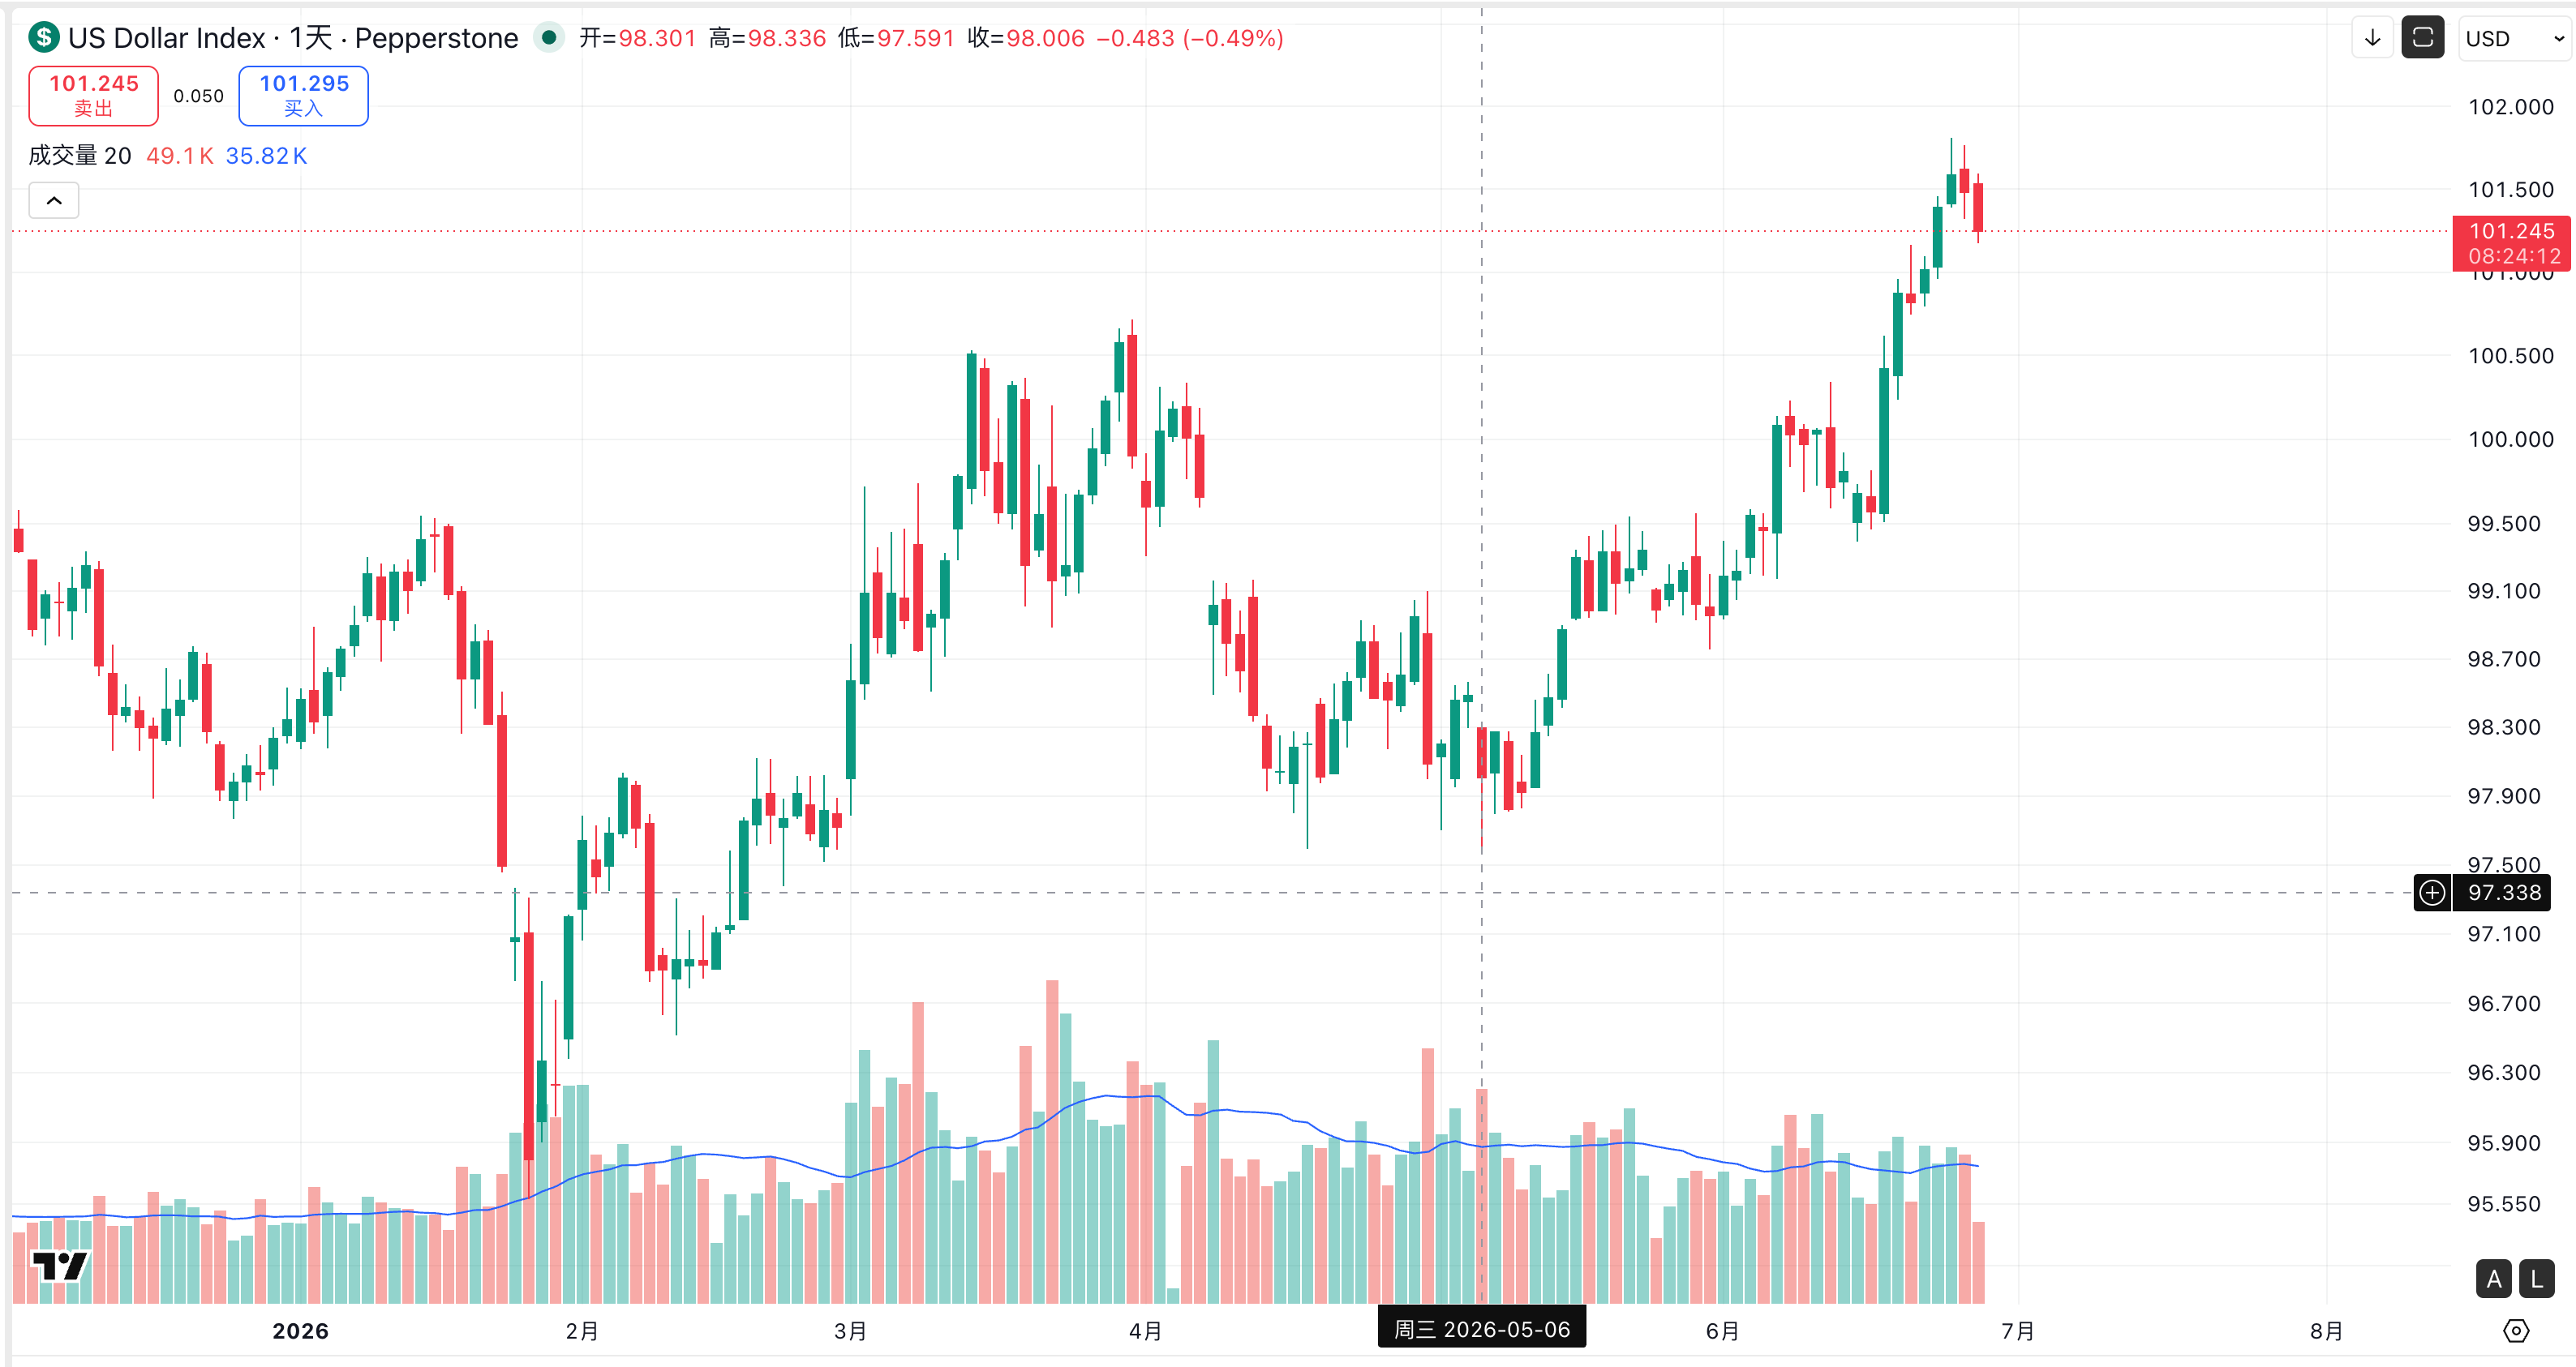
Before analyzing how the subsequent market will unravel, let’s take a look at a chart. The chart below shows the trend of the US Dollar Index (DXY); attentive readers might notice that the DXY hit a temporary bottom on May 6, then began a sustained rise, corresponding to BTC's continued decline.
The rise of the DXY reflects the market's shift from expecting interest rate cuts to trading for rate hikes. It is also one of the manifestations of "tightening dollar liquidity." Hence, it is not hard to understand why BTC transitioned to a decline during this period.
On June 23, market trading sentiment regarding interest rate hikes peaked in the short term. On that day, global stock markets and the cryptocurrency market all plummeted. The PCE data on June 25, although not promising, did not indicate significant further increases in interest rate expectations, and there were temporarily no catalysts for further deterioration. The next two important catalysts will occur on July 2 and July 14.
Considering the fundamental conditions and the price-volume judgments from the first part of the article, I believe there are three scenarios for the upcoming period:
Scenario One (I personally lean towards this trend):
The decline temporarily pauses, respecting the current buying power around 59,000, and the market will first undergo a rebound for a while. If the data on July 2 is acceptable, a further rebound can happen. Then we will look at the data on July 14. For the rebound target, let's initially look near 65,000-67,200, where a slight breakthrough is highly probable, creating a daily W-bottom pattern that captures liquidity from breakout chase and short stops.
After the rebound ends, there will be another correction, testing 59,000. As the saying goes, “things don't go past three,” the next time it returns to around 59,000 should be decisive.
Scenario Two:
Directly breaking below, heading straight for 50,000. If we see a significant drop below 58,000, the likelihood of this scenario increases. We will not consider this scenario until it breaks through.
Scenario Three:
False break, returning, then rebounding. If after breaking below 58,000, it quickly returns to around 60,000, then this trend is highly probable.
I personally lean towards Scenario One. Since May, it has already fallen by nearly 30%, the short-term decline is substantial, and the buying power around 59,000 still exists. Furthermore, the macro level has not worsened. Thus, I favor a short-term rebound first, then another decline.
For confirmation signals, pay attention to the 2-hour level downward trend line; if it breaks, it increases the likelihood of Scenario One.
3. How to view July's market trends from the hexagram perspective?
The hexagram trend analysis from April to June was basically correct. The only shortcoming was that the overall monthly trend in June was correct, and what needed to fall indeed fell, but there were still some discrepancies within the month. The hexagram is also a trend-oriented analysis, and if one wants to be precise to the daily level, there are indeed too many disturbing factors.
In July 2026, which is the year of Bing Wu and the month of Yi Wei (July 7 - August 6), its trend is not a simple continuation of the month of Jia Wu but transitions from "impulsive financial roots" to "piercing harmful financial roots." The main symbol of the Jia Wu month is the Wu fire directly clashing against the original structure of Gemini, represented by strong volatility, rapid declines, spikes, and quick revaluations; the main symbol of the Yi Wei month is Wei earth piercing Zi water, reflected in repair thickening, oscillation digestion, gradual decline, or stair-step consumption.
The Jia Wu month: Wu fire directly clashes against Zi water. The Yi Wei month: Wei earth pierces and harms Zi water. One is clashing, and the other is piercing. Clashing is explicit, fierce, and quick to change direction; piercing is internal consumption, sluggish, and repeatedly grinding.
In the Jia Wu month, the monthly support of Wu fire superimposes the yearly Wu fire, charging against the original year's Gemini. The clash between Zi and Wu is a great taboo that easily brings extreme volatility, strong divergence, deleveraging, or risk release.
The Yi Wei month = Zi Wei pierces, chronic consumption. In the Yi Wei month, the monthly stem Yi wood reveals, and the monthly branch Wei earth is in order. Wei is dry earth and forms a Zi Wei penetrating, a crucial risk point for chronic erosion of financial roots; meanwhile, Wei easily engages in the Hai, Mao, Wei wood formation, invoking the momentum of wood and fire. The Yi Wei month is like "slow grinding with a file."
Observe volatility in the Jia Wu month and persistent consumption in the Yi Wei month. Therefore, the price trend in the Yi Wei month is not characterized by "crash" but rather "weak rebound, oscillation, gradual decline, and step-wise wear and tear."
Follow me, maximize trend profits with minimal operation.

免责声明:本文章仅代表作者个人观点,不代表本平台的立场和观点。本文章仅供信息分享,不构成对任何人的任何投资建议。用户与作者之间的任何争议,与本平台无关。如网页中刊载的文章或图片涉及侵权,请提供相关的权利证明和身份证明发送邮件到support@aicoin.com,本平台相关工作人员将会进行核查。