Cryptocurrency Scholar: Is the Weak Pattern of Ethereum (ETH) on June 27 Difficult to Reverse? Latest Market Analysis Reference
The current price of Ethereum is 1585. Before writing this, I looked at the posts in the square, most of them are about bottom fishing; friends buying spot can start to layout. As for contracts, strict profit-taking and stop-loss are still needed. The current market situation is a typical weak oscillation downward, with both opportunities and risks on the table. The story of ETH is not over, but now is not the time to be impulsive. Follow the signals and don't let emotions lead you astray.
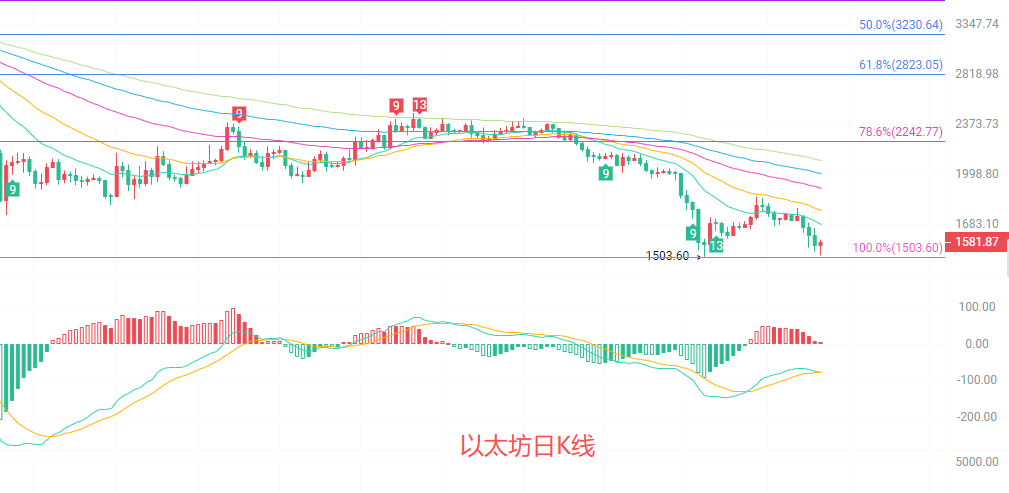
The daily K-line is in a clear downward trend, with prices consistently operating below the EMA15/30/60/90/120 moving averages. The moving averages are arranged downward, and there are no obvious reversal signals for the downward trend. The MACD indicator shows that both DIF and DEA are below the zero axis. After a brief expansion, the red bars have weakened again. Although there are signs of exhaustion in the downward momentum, it still dominates. The Bollinger Bands are continuously opening downward, and the price has fallen below the lower Bollinger Band. 1503 is a strong support level recently, while 2242 is a critical resistance at the Fibonacci 78.6%. It is difficult to break through this range in the short term; the overall weak pattern is hard to change.
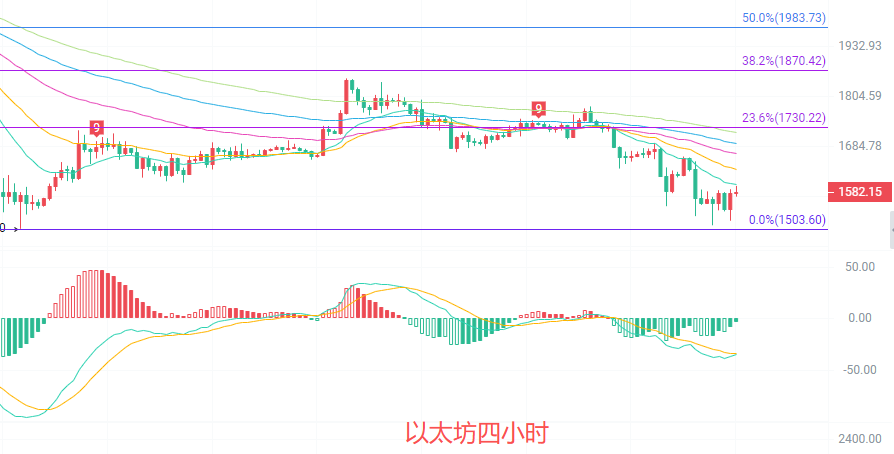
The four-hour K-line has once again fallen below the EMA15/30 moving averages, and the short-term moving averages have formed new resistance. The 23.6% Fibonacci level at 1730 has become a strong pressure for rebounds. The MACD indicator shows that the DIF crosses below the DEA, and the green bars continue to expand, with downward momentum being released again. The Bollinger Bands are opening downward, and the price is operating along the lower track. Currently, 1581 is near the lower Bollinger Band. There is a slight rebound demand in the short term, but the strength is limited. The previous low of 1503 is a strong support. If this level is lost, the downside space will further open up; the region of 1630-1680 above is the resonance suppression area of the moving averages and the middle track of the Bollinger Bands. If the rebound does not break this range, the focus is still on short positions.
Short-term Reference:
As long as the level from 1520 to 1470 doesn't break down, take a long position with a stop loss of 50 points, targeting 1570 to 1620.
If the level from 1630 to 1660 doesn't break up, take a short position with a stop loss of 50 points, targeting 1600 to 1550.
The specific operation should be based on real-time data from the market. For more detailed information, you can consult the author. The release of the article has a delay, so the information is for reference only, and risks are to be borne by oneself.

Warm Reminder: The above content is only created by the author of the WeChat public account; the advertisements at the end of the article and in the comments section are unrelated to the author. Please be cautious in distinguishing them. Thank you for reading.
免责声明:本文章仅代表作者个人观点,不代表本平台的立场和观点。本文章仅供信息分享,不构成对任何人的任何投资建议。用户与作者之间的任何争议,与本平台无关。如网页中刊载的文章或图片涉及侵权,请提供相关的权利证明和身份证明发送邮件到support@aicoin.com,本平台相关工作人员将会进行核查。