(1) Macroeconomic Bearish (Dominating the Current Downtrend)
1. Rising Expectations for Federal Reserve Rate Hikes
Core PCE inflation in the U.S. for May is 3.4%, higher than expected. Multiple investment banks (Bank of America, Deutsche Bank) have raised their expectations for rate hikes in 2026, with a possibility of a rate hike in the September meeting; U.S. Treasury yields are rising, with funds continuously flowing out of high-risk, interest-free assets like gold and cryptocurrencies.
2. The Aftershocks of the $10 Billion BTC Options Expiration
On June 26, $10 billion nominal value of BTC options was settled, with a high proportion of put options leading market makers to hedge aggressively and suppress coin prices; $984 million in liquidations occurred across the market in 24 hours, with more than 170,000 traders closing positions, 80% of which were long positions.
3. Geopolitical Risks Pressuring Risk Appetite
Ongoing shipping conflicts in the Strait of Hormuz are intensifying, while fluctuations in oil prices are raising global risk aversion, leading funds to shift towards the dollar and U.S. Treasuries, with continued outflows from the crypto market.
(2) Industry Neutral/Bullish Hedging
1. Divergence in Institutional Funds
BlackRock transferred 2,700 BTC and a large amount of ETH to Coinbase, with long-term institutions accumulating coins at lower prices; however, MicroStrategy's stock price significantly dropped, raising concerns in the market about its high leverage debt repayment pressure, which temporarily suppressed BTC sentiment.
2. Solana Chain Brings Short-term Support
Solana has launched a feature for sharing on-chain trading links, and DEX trading volume increased by 12% within a day, with a short-term rebound of 8%, making it the strongest mainstream coin for the day; SOL spot ETFs have seen net inflows for 7 consecutive days, totaling $674 million.
3. Adjustments in the Ethereum Ecosystem
The Ethereum Foundation has cut its budget by 40% and laid off 20% of its staff, with several executives leaving, creating short-term concerns about ecosystem confidence; however, L2 transfer and staking volumes remain stable, and mid-to-long term narratives remain intact.
(3) On-chain Data Signals
• More than half of BTC holding addresses have entered a state of unrealized losses, with historical data corresponding to phase bottom areas; in the past 72 hours, miner hashrate has dropped by 10%, with small-to-medium miners shutting down and reducing production.
• Overall market liquidity contracted at the end of the quarter, with quarter contracts set to clear in July, making it easy to fall but difficult to rise in the short term.
2. Real-time Market Conditions & Technical Levels for Mainstream Coins
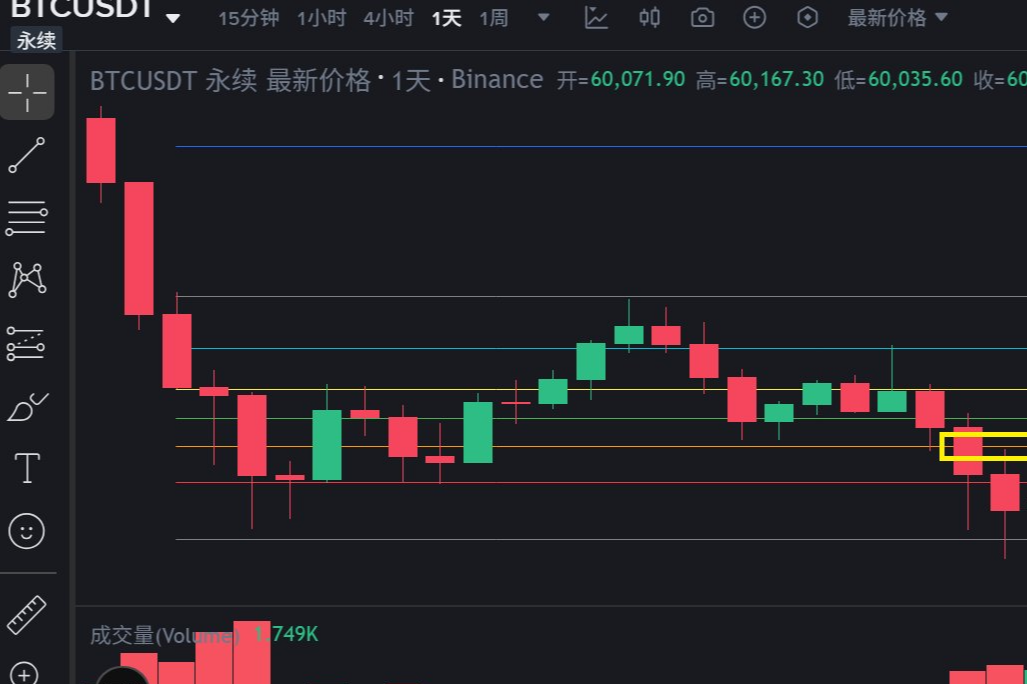
1. BTC Bitcoin
After probing the bottom at 58,100, it rebounded; 24-hour decrease of 1.9%
Key Support/Resistance
• Strong Support: 58,000 (daily low), 54,000 (mid-term downward target)
• Daily Weak Support: 60,000 (psychological level)
• Short-term Resistance: 63,000, 68,200 (50-day moving average, dividing long and short)
• Strong Resistance: 78,198 (200-day moving average, signaling a bull market reversal)
Technical Judgment
The daily chart has broken the bearish flag pattern, and the bearish trend is clear; short-term oversold rebound, but volume is insufficient, and the rebound is a technical repair rather than a reversal of the downward structure.
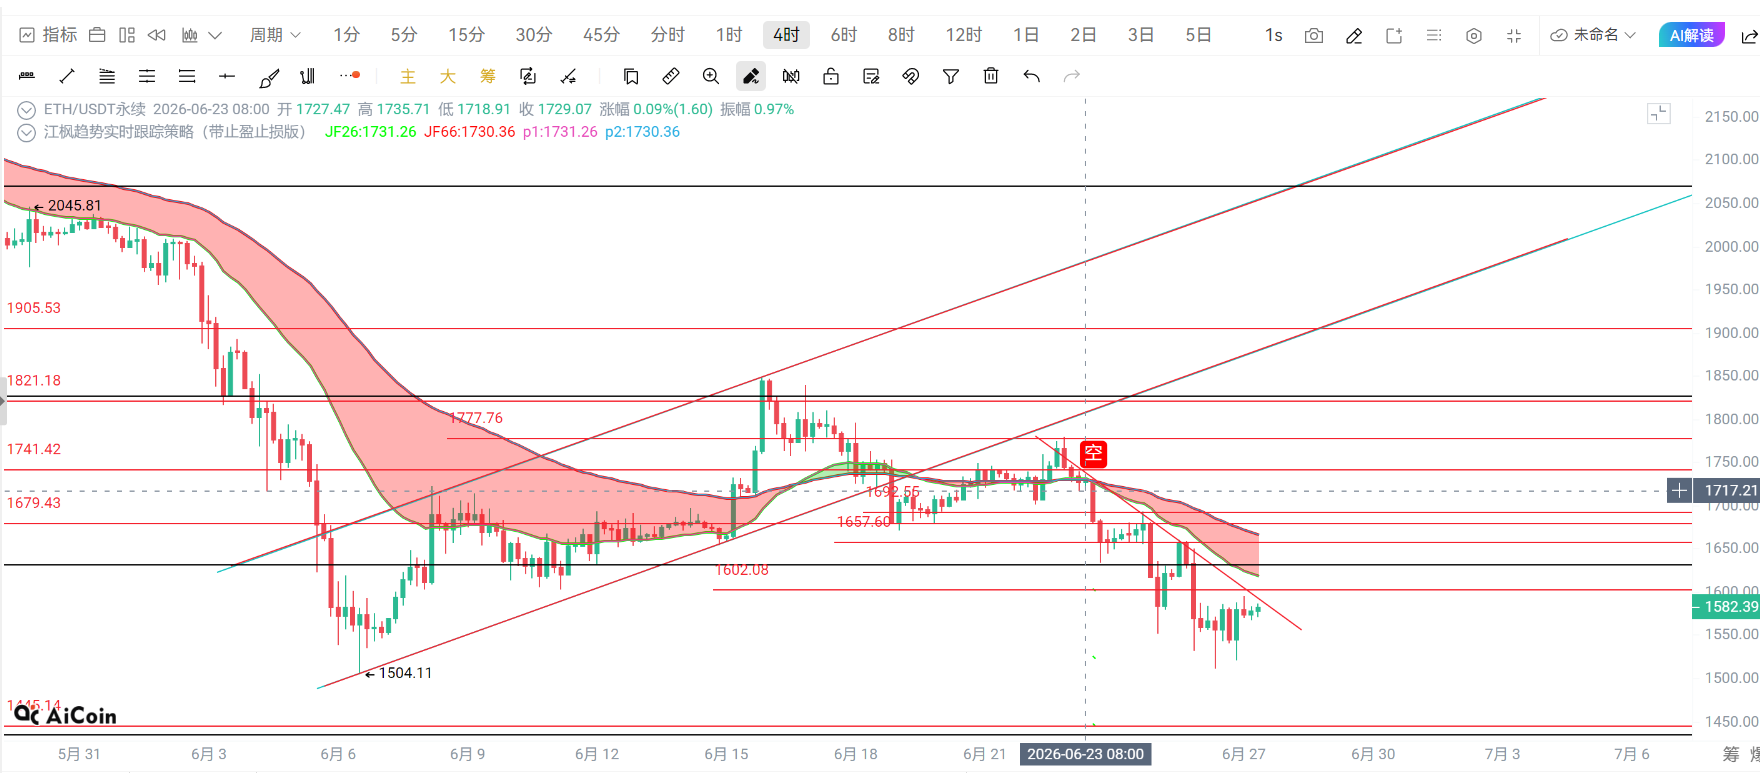
2. ETH Ethereum
24-hour decrease of 2.3%, weaker than BTC
Key Support/Resistance
• Lifeline Support: 1,500–1,505 (weekly key bottom, breaking this opens a decline to 1,400)
• Daily Support: 1,550
• Short-term Resistance: 1,655–1,660 (strong selling pressure area on rebound)
• Mid-term Division: 1,698 (only stabilizing above this level can reverse bearishness)
Technical Judgment
Following BTC's decline closely, the 1,500 level is the last defense for bulls; RSI remains low, but no clear bullish divergence, making bottom-fishing very risky.
3. SOL Solana
Current Quote: 68.61 USDT, slight increase of 0.74% in 24 hours, the only mainstream coin going against the trend
Key Support/Resistance
• Strong Support: 64 (daily low), 60–61 (mid-term downward target)
• Neckline Support: 68 (key level for breaking the double top)
• Short-term Resistance: 70.7, 76–78 (previously oscillating central area)
• Reversal Resistance: 81 (50-day moving average)
Technical Judgment
The daily chart forms a bearish double top, relying on on-chain benefits to resist declines briefly; if the market plunges again, SOL's high Beta attribute will amplify the decline, making it suitable for short-term light-position speculation.
3. BTC/ETH/SOL Practical Thoughts
(1) BTC
1. Holding Spot
• Cost above 68,000: Reduce positions in batches when rebounding to 62,500–63,000, reducing total positions to below 30%;
• Cost below 60,000: Hold if 60,000 is not broken, significantly reduce holdings if it breaks below 58,000, waiting for incremental buying in the 54,000 range.
2. Observers with No Positions
Don't rush to bottom-fish, choose one of two entry conditions:
① Daily volume stabilizes above 68,200, confirming trend reversal before gradually building positions;
② Pullback to 54,000–56,000 range for scheduled long-term investments in three batches.
(2) ETH
1. Holding Spot
Keep a close eye on the 1,500 lifeline, reduce holdings by 50% if the closing price breaks below 1,500; if it holds at 1,500, you can hold with a light position, reducing holdings above 1,650 on rebound.
2. No Position
Only two safe buying points:
① Stabilizing at 1,698, the dividing point between bulls and bears on the daily line;
② Deeply buying in the 1,400–1,450 retracement support range.
(3) SOL Strategies
1. Holding Spot
Take profit in batches in the 70–76 range during rebounds; if it effectively breaks below the 68 neckline, reduce all positions to avoid double top downtrend risks.
2. Short-term Speculative Trading with No Position
Only stabilize near 64 can very small positions be used for long positions, with stop-loss below 63, target 70; only if it breaks above 78 and stabilizes can you anticipate the continuation of the rebound; do not chase high.
4. Core Indicators for Observing Future Market Trends (to Decide July's Movement)
1. Whether BTC can hold above 58,000 support and increase volume above the 68,200 moving average;
2. U.S. non-farm and PCE inflation data in early July, and hawkish/dovish remarks from Federal Reserve officials;
3. The sustainability of the inflow/outflow of spot BTC/ETH ETFs;
4. Whether SOL can recover the key range of 78, with on-chain trading volume continuously warming up.
[Invitation to Join the Cryptocurrency Community Group]
1. 📢 24-Hour Live Classes + 15 Senior Analysts
2. Trading Department | Helping you solve various trading questions and liquidation issues
3. 📈 Real-Time Trading Courses | Keep pace with the market rhythm, hands-on practical teaching
24-Hour Tencent Meeting: 549-938-1356
Scan to join Safew

免责声明:本文章仅代表作者个人观点,不代表本平台的立场和观点。本文章仅供信息分享,不构成对任何人的任何投资建议。用户与作者之间的任何争议,与本平台无关。如网页中刊载的文章或图片涉及侵权,请提供相关的权利证明和身份证明发送邮件到support@aicoin.com,本平台相关工作人员将会进行核查。