Crypto Circle Scholar: Is the multi-dimensional indicator for Ethereum (ETH) on June 29 not yet welcoming a reversal opportunity? Latest market analysis reference
Ethereum is currently priced at 1570. To be honest, I have fallen into the trap of such a downward continuation before. I always felt that when it drops too much, it is the bottom; stubbornly holding on without stopping losses leads to deeper entrapment, and finally, there is no courage left to cut losses. Looking back now, it is not that the market did not give opportunities; it was my own greed, always wanting to make a comeback in one go. Regarding the current situation of Ethereum, I do not advise you to catch the bottom or shout to go short; just one sentence: light positions, set stop losses, don’t go against the trend; if you can survive, that’s a win
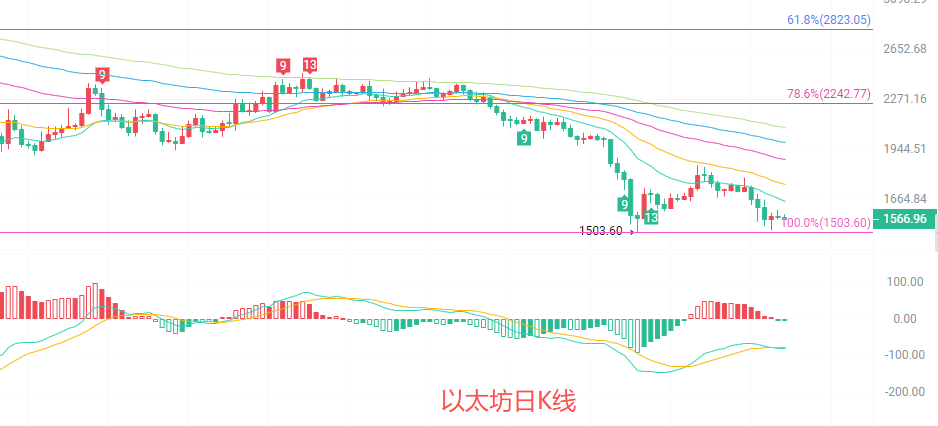
The daily K-line has reached the 100% Fibonacci extension level of the previous low point of 1503, belonging to a weak rebound at the end of a downtrend. The moving average system is all arranged downward, with the price pressured below EMA15; the medium-term trend is still bearish. The MACD indicator shows green bars continuously shortening, with DIF still below DEA; the downward momentum has weakened, but it has not formed a clear golden cross signal. The lower Bollinger Band near 1536 provides short-term support, overall still in a weak bottoming phase
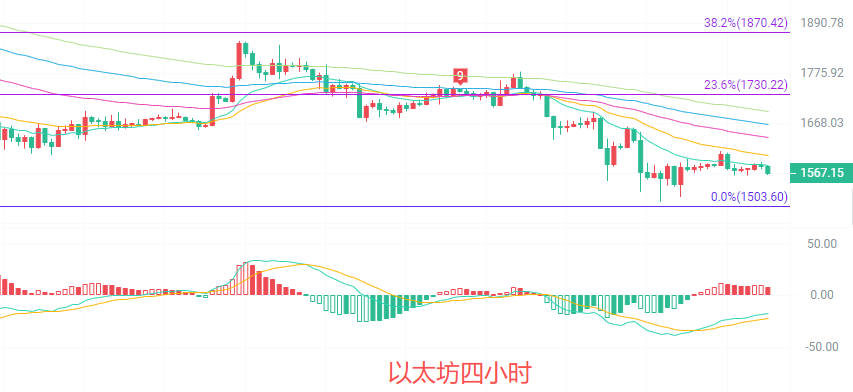
The four-hour K-line is in a narrow range oscillation between the lower Bollinger Band at 1550 and the middle band at 1574. The opening of the Bollinger Bands continues to narrow, compressing the short-term volatility space. The moving average system is still arranged downward, with the price pressured under EMA15 and EMA30, showing very weak rebound strength. The MACD indicator forms a golden cross below the zero axis, with red bars slightly increasing in volume, indicating a willingness to move north in the short term but facing strong resistance around the 23.6% Fibonacci level near 1730; if it cannot break through, the downtrend is likely to continue
Short-term reference:
If the lower range of 1550 to 1520 does not break, aim north, set a stop loss of 50 points, target 1590 to 1630
If the upper range of 1620 to 1650 does not break, aim south, set a stop loss of 50 points, target 1590 to 1550
Specific operations should be based on real-time market data. For more detailed information, please consult the author. Articles may have delays in publication, so advice is for reference only, and risks are to be borne by yourself.

A friendly reminder: The above content is solely created by the author of the public account; the advertisements at the end of the article and in the comment section are unrelated to the author. Please discern carefully, thank you for reading
免责声明:本文章仅代表作者个人观点,不代表本平台的立场和观点。本文章仅供信息分享,不构成对任何人的任何投资建议。用户与作者之间的任何争议,与本平台无关。如网页中刊载的文章或图片涉及侵权,请提供相关的权利证明和身份证明发送邮件到support@aicoin.com,本平台相关工作人员将会进行核查。