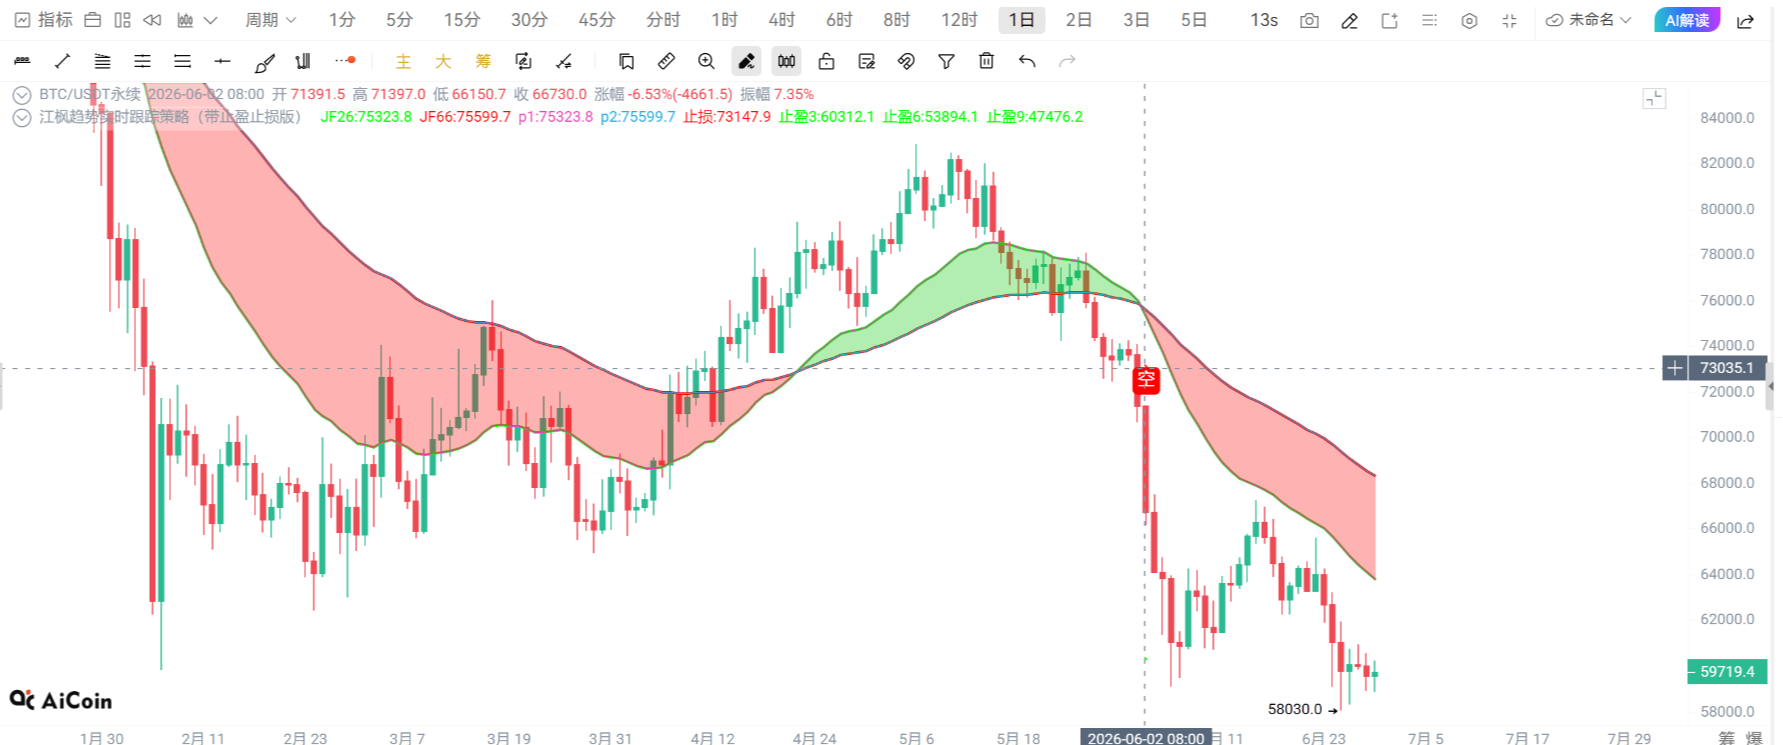
The weekend market maintained a range-bound consolidation for two consecutive days, with clear upward and downward spikes on the daily chart, indicating that both bulls and bears are still repeatedly testing the bottom area. The weekly closing ended with a bearish candle, and the daily chart showed a long spike structure. Although the short-term trend still leans bearish, there have already been obvious signs of bottoming out in the market.
If another sharp decline occurs this week, it might actually become a better buying opportunity. Many times, negative news is not necessarily a bad thing, as a truly effective bottom often requires a quick drop to complete the final round of chip clearing. If a long lower shadow can be formed on the weekly chart, it will be more favorable for the subsequent rebound and repair.
From a structural perspective, the daily chart has shown features of repeatedly testing the bottom, and during the decline, we can see that funds are quickly picking up, indicating that there is not a complete lack of buying at low levels. Although the overall trend remains in a bearish structure, the most pessimistic moments for the market often coincide with the gradual approach of opportunities.
The geopolitical situation will still disturb market sentiment, but as long as it is not a catastrophic risk, the market cannot be continuously suppressed by news. As sentiment is gradually digested, prices will ultimately return to the fundamentals of funds, cycles, and structure.
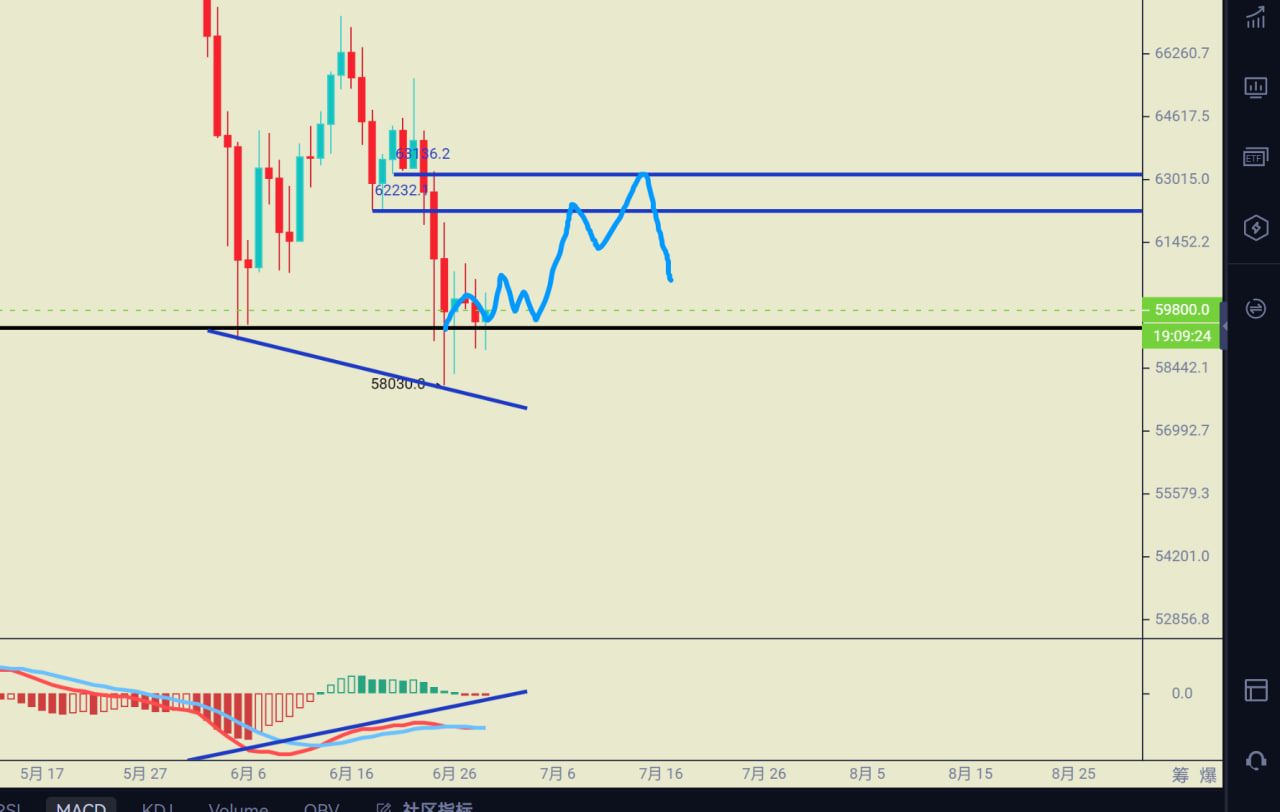
For Bitcoin, the current strategy is more suitable for focusing on buying on sharp dips, with short selling on rallies as a supplementary strategy. Volatility is expected to increase on Monday, and it is not advisable to chase highs or sell lows in the short term. The daily chart shows signs of forming a bottom, but the process of bottoming requires time and will not be achieved overnight. Currently, the daily, weekly, and monthly charts are gradually approaching the bottom area, and the half-day chart has begun to turn bullish, with an emphasis on waiting for a significant cycle resonance signal.
Support levels to watch: 58800-59000, 58030, 57200-57600
Resistance levels to watch: 60000-60200, 60500-61000
Tencent Meeting 24-hour live broadcast room: 759-223-4196

This article is published by 【Huiying Community】 and represents personal views only. Due to some latency in information transmission, the content is for reference only and does not constitute any investment advice. Please make rational judgments and operate cautiously.
If you need more timely daily market analysis and strategy ideas, feel free to add Safew's contact information, or add the three lines: MY89080, to join the group for free learning.
The community has 15 professional analysts monitoring the market live all day. Here, you can not only learn technical analysis methods in practice, but also systematically understand strategies for position closing and risk control systems.
免责声明:本文章仅代表作者个人观点,不代表本平台的立场和观点。本文章仅供信息分享,不构成对任何人的任何投资建议。用户与作者之间的任何争议,与本平台无关。如网页中刊载的文章或图片涉及侵权,请提供相关的权利证明和身份证明发送邮件到support@aicoin.com,本平台相关工作人员将会进行核查。