This week, BTC is currently in the final phase of a five-wave corrective structure, and the formation location of "endpoint 44" determines the short-term direction—above 58,110 has a high probability of a rebound, below it without a bullish divergence requires caution for further breakdown. We have preset three operational plans A/B/C, maintaining a 20% medium-term short position and retaining a 30% short-term position to look for arbitrage opportunities.
At the same time, HYPE has begun a five-wave correction from the high of 76.94, currently running to the 55-56 phase. If "endpoint 56" forms a double bottom above the previous low, the probability of a rebound is significant; after the support area stabilizes, we can lightly buy with tight control of positions below 30%.
For complete structural analysis, quantitative model signal interpretation, and specific operational plans, please refer to the full weekly review this week.
This week's core trading viewpoints summary
- BTC hourly structural analysis (detailed in the first section)
- BTC market outlook and medium- and short-term trading strategies (detailed in the second section)
- HYPE hourly structural analysis (detailed in the third section)
- HYPE market outlook and short-term trading strategies (detailed in the fourth section)
Last week's trading strategy and core viewpoints market verification
- BTC short-term trading efficacy: Bitcoin completed two short trades last week (1x leverage), successfully achieving a profit of approximately 6.21%. (Detailed in the fifth section)
- BTC market trend outlook market verification: In last week's review, we predicted (as shown in Figure 1) that if "endpoint 41" could not stabilize above the lower track of the channel, the market would likely retest the previous low support of 59,100 USD. Currently, the overall market trend has verified this viewpoint.
1. In-depth analysis of Bitcoin hourly structural trends
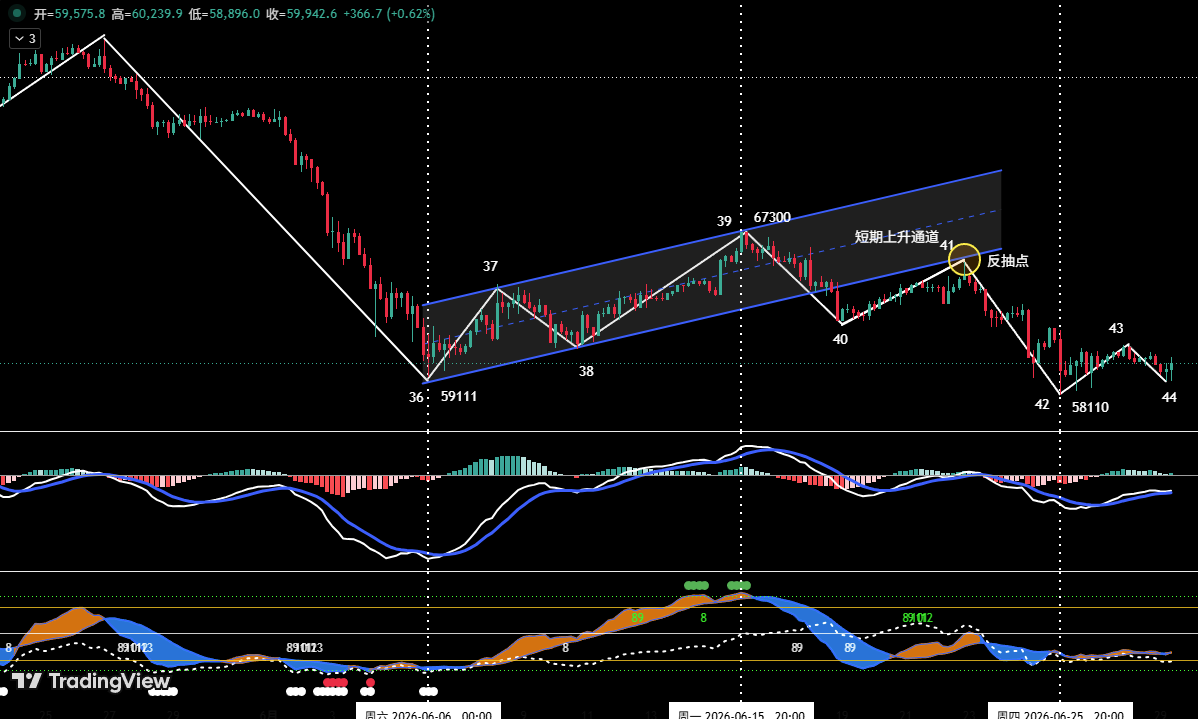 Figure 1 Bitcoin _4 Hour K-Line Chart
① As shown in (Figure 1): Last week's review clearly pointed out that (40-41) is the pullback to confirm the breakdown of the short-term ascending channel (blue channel). If "endpoint 41" cannot re-stabilize above the lower track of the channel, the trend will weaken, increasing the probability of a retest of the previous low support of 59,100 USD. The chart shows that the lowest adjustment last week touched 58,110 USD to gain short-term support.
② From the 4-hour period analysis, the oversold rebound that started from the low of 59,100 USD on June 6 has been confirmed to end at "endpoint 39" (67,300 USD).
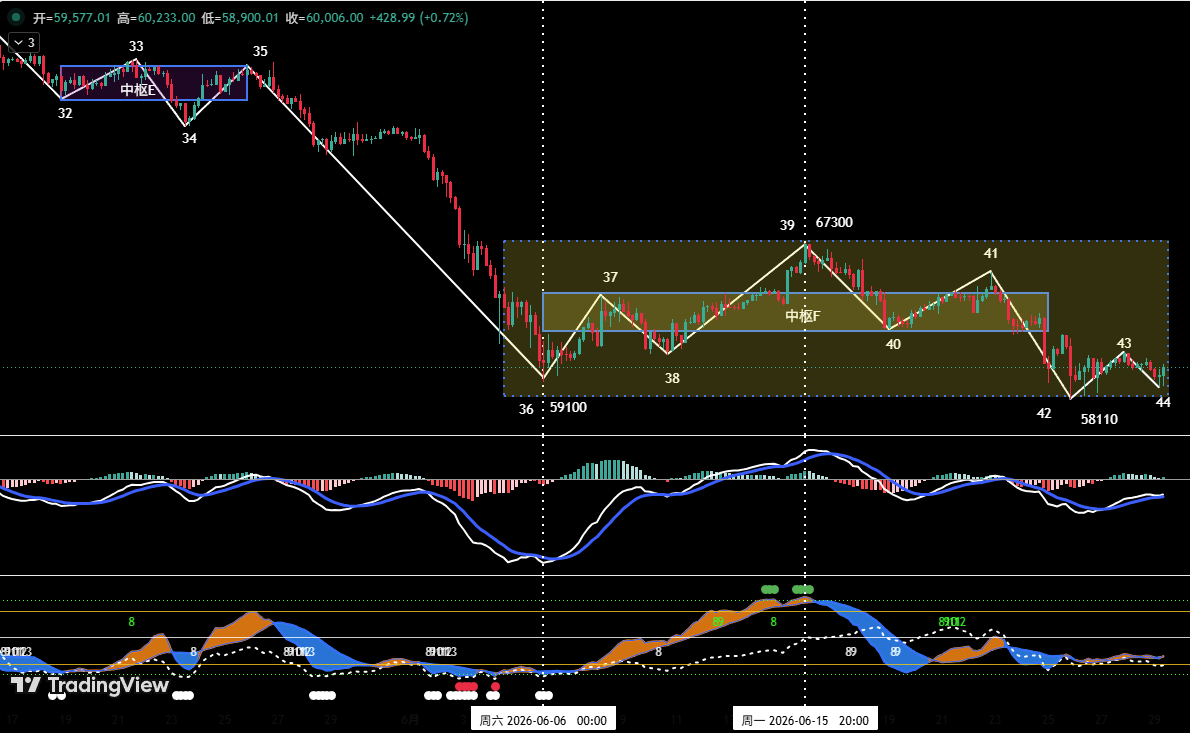 Figure 2 Bitcoin _4 Hour Chart
③ As shown in (Figure 2): Since "endpoint 39", the market has entered a clear 5-wave corrective structure (from endpoint 39 to endpoint 44), and is currently in the (43-44) adjustment phase.
The final position of "endpoint 44" will become the key to the short-term direction:
- If "endpoint 44" is above 58,110 USD: A stronger technical rebound is expected, likely entering broad range fluctuations afterward.
- If "endpoint 44" is below 58,110 USD and shows a momentum divergence: A rebound opportunity also exists, but the strength of the rebound needs to be observed.
- If "endpoint 44" is below 58,110 USD and shows no momentum divergence: After a short-term adjustment, the price may further break down.
④ Summary: From our self-built quantitative model analysis, we believe that the first two scenarios are relatively more probable.
2. Bitcoin market outlook and trading strategy this week
1. BTC market trend prediction this week
This week's core viewpoint: Focus on the formation of "endpoint 44". If the first scenario occurs, consider lightly buying short-term.
2. Core resistance levels
- First resistance zone: 60,900–62,300 USD (previous important high and low positions)
- Second resistance zone: Around 65,500 USD (previous important resistance zone)
- Third resistance zone: 67,300–69,500 USD (previous important resistance zone)
3. Core support levels
- First support level: Around 58,100 USD (previous important support level)
- Second support level: Around 55,000 USD (previous important support level)
4. Trading strategies this week (excluding sudden news impact)
① Medium-term strategy
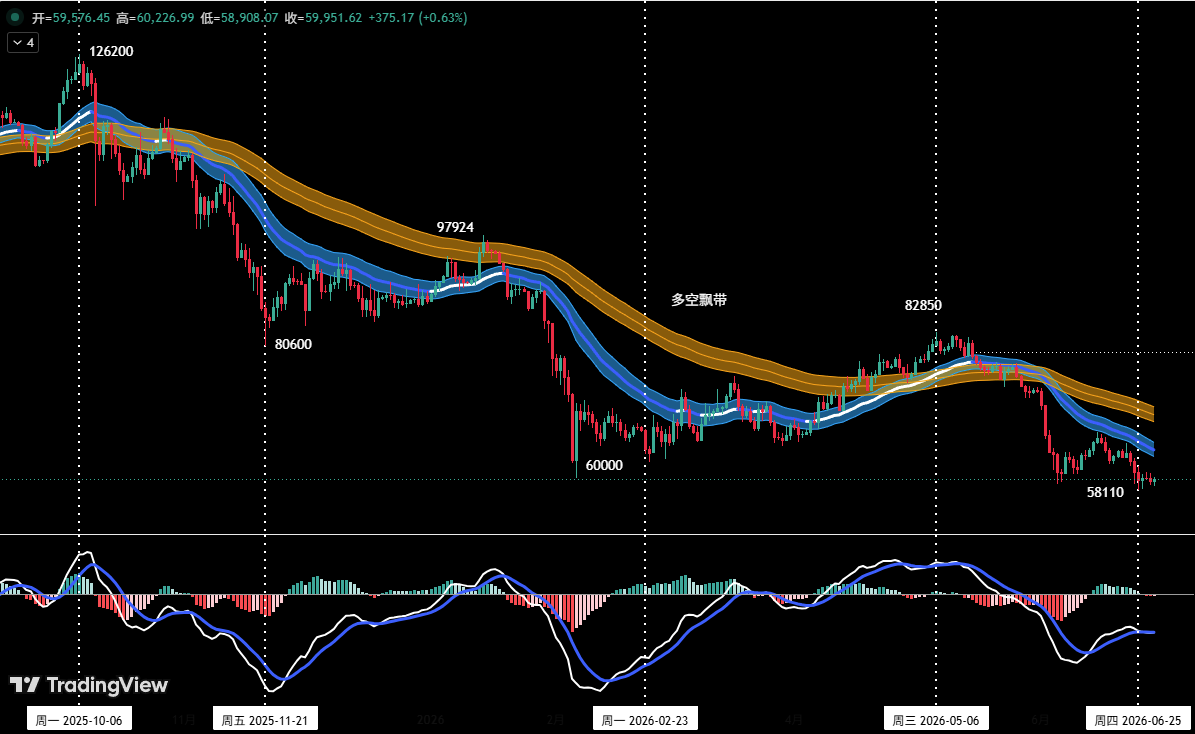 Figure 3 Bitcoin _ Daily K-Line Chart (Position Monitoring Model)
Position monitoring model: As shown in (Figure 3), the current price has effectively broken below the "bull-bear channel", confirming that the market structure has shifted to a bearish dominant pattern. Maintain a medium-term short position of about 20% for now.
② Short-term strategy
Using 30% of the position, set a stop-loss point, based on support and resistance levels, looking for opportunities to create "arbitrage" (using 30 minutes/60 minutes as the operating cycle).
③ A/B/C three operational plans
In short-term operations, to dynamically respond to the complex evolution of the market, we have pre-formulated three specific operational plans A/B/C.
Plan A: Tentatively buy in the strong support area (if endpoint 44 is above 58,110 USD)
- Open position: If the price forms the above scenario, and combined with the quantitative model signal, establish a long position of about 15%.
- Risk control: Set the initial stop-loss position.
- Close position: When the price rebounds near important resistance and combines with the quantitative model signal, gradually liquidate for profit.
Plan B: Lightly short in the resistance area
- Open position: If the price rebounds to the 60,900–62,300 USD area and shows a pressure signal, combined with quantitative model top signals, establish an initial short position of about 15%.
- Risk control: Set the initial stop-loss position.
- Close position: When adjusting to the important support area and combined with model signals, gradually liquidate for profit.
Plan C: Increase short positions in the strong resistance area
- Add to position: If the price continues to rebound to around 65,000 USD or even near 67,300 USD with a stagnation signal, and combined with quantitative model top signals, consider increasing the short position to within 30%.
- Risk control: Set the initial stop-loss position.
- Close position: When it falls to important support and combined with model signals, gradually liquidate for profit.
3. HYPE hourly structural analysis
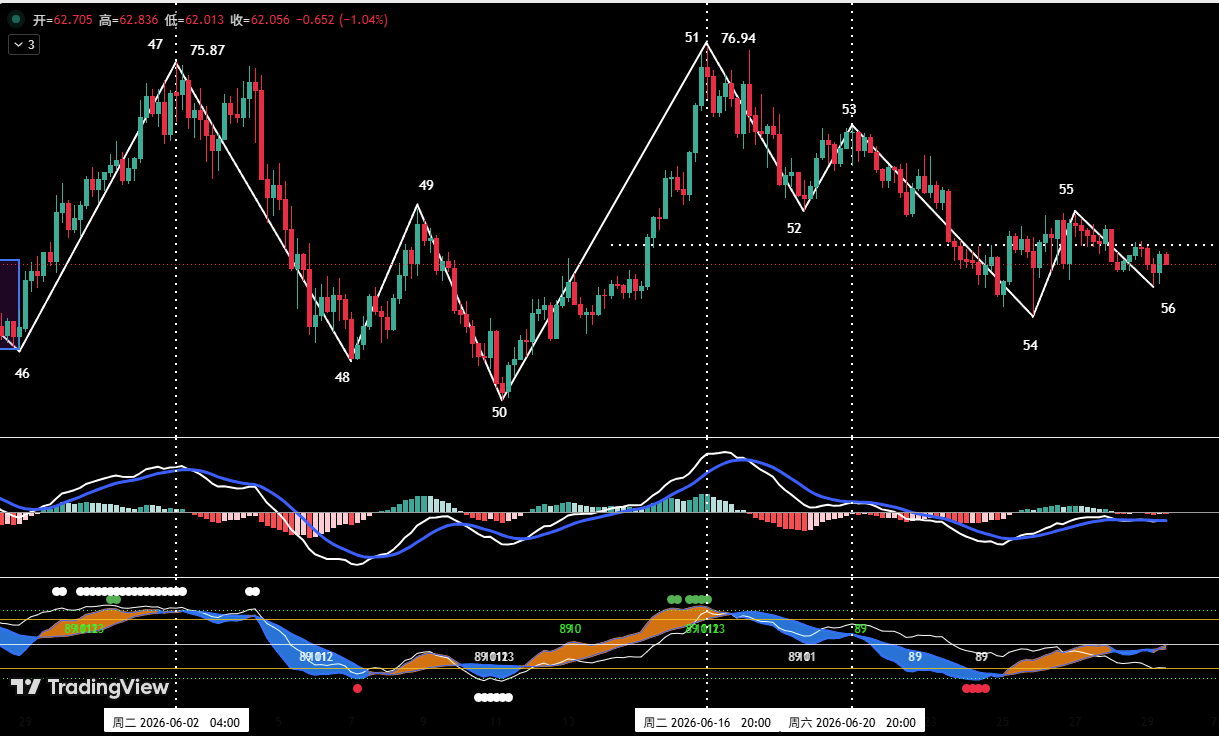 Figure 4 HYPE_4 Hour K-Line Chart
① As shown in (Figure 4), HYPE started to adjust from the peak of 76.94 USD (endpoint 51) on June 16. The 4-hour period can be subdivided into a five-wave corrective structure, namely 51-52, 52-53, 53-54, 54-55, and 55-56 phases. The price is currently running in the 55-56 phase, and the location status of "endpoint 56" constitutes the key to recent price trends.
② Short-term adjustment ending scenarios:
- If "endpoint 56" is above "endpoint 54", it will form a "double bottom" pattern, this round of adjustment may end, with a high probability of a rebound starting at "endpoint 56".
- If "endpoint 56" is below "endpoint 54", but forms a momentum bottom divergence, the probability of ending this round of adjustment is also large, and there is a rebound market.
③ Short-term adjustment continuation scenarios:
- If "endpoint 56" is below "endpoint 54", and there is no momentum bottom divergence, this round of adjustment may continue as a seven-wave corrective structure.
④ From our self-built quantitative model analysis, the probability of forming the first type of trend is significant.
4. HYPE market outlook and short-term trading strategy this week
1. HYPE market trend prediction this week
Core resistance levels:
- First resistance level: Around 65.5 USD
- Second resistance level: Around 71.5 USD
Core support levels:
- First support level: Around 58.5 USD
- Second support level: Around 52–54 USD region
This week's core viewpoint for HYPE: Observe the final position and technical pattern upon the formation of "endpoint 56".
2. HYPE short-term trading strategy this week (support to buy)
This week's short-term trading for HYPE should follow the "buy on dips and avoid chasing highs" strategy.
Short-term strategy: Stabilize and attempt to buy near the support area. When the HYPE price adjusts above 58.8 USD, or in the deeper support area of 52–54 USD, if there are signs of a bottom and stabilization, combined with bottom signals triggered by the two major models, consider lightly buying, keeping positions controlled below 30%, and strictly adhering to stop-loss discipline.
5. Bitcoin short-term trading review
We strictly followed the operational plans, utilizing the trading signals generated by our independently constructed "arbitrage trading model" and "momentum quantitative model," completing two short trades last week for a total profit of approximately 6.21%.
1. Short-term trade one
Details of the Bitcoin short-term trade (leverage × 1):
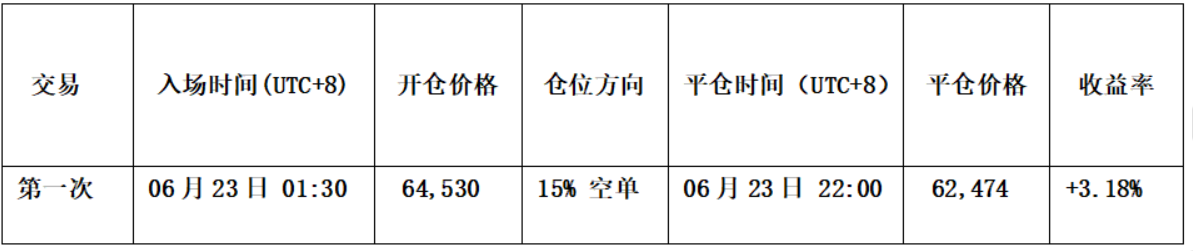 Open position strategy:
- When the price rebounds to around 65,500 USD and encounters resistance, and there are pressure signals, the K-line forms a "head and shoulders" bearish signal;
- The "arbitrage trading model" triggers a top warning signal (white point), with the "momentum quantitative model" forming a momentum top divergence signal.
Thus, we established a 15% short position at 64,530 USD.
Close position strategy:
- When the price falls to around 62,000 USD and stops falling, the K-line forms a "bottom head" signal;
- The "arbitrage trading model" triggers a strong bottom warning signal (red point + white point), and forms a bottom resonance signal with the "momentum quantitative model."
Therefore, we liquidated all at around 62,474 USD.
Summary: This trade successfully achieved a profit of approximately 3.18%.
2. Short-term trade two
Details of the Bitcoin short-term trade (leverage × 1):
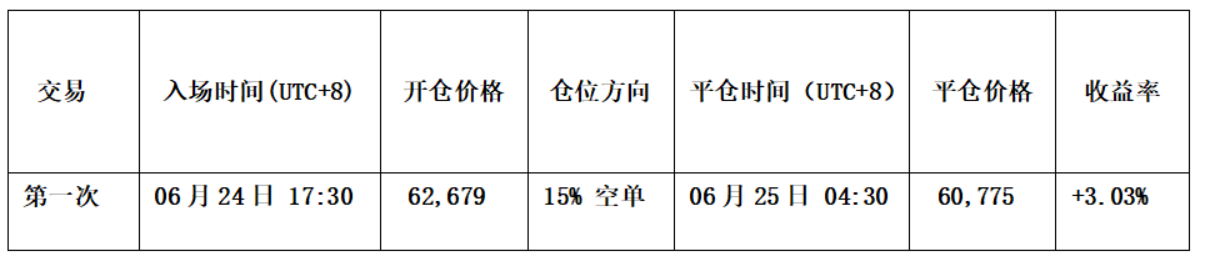 Open position strategy:
- When the price runs to about 63,000 USD, the "momentum quantitative model" shows two momentum lines nearing the "zero axis," creating a momentum exhaustion state, followed by forming the first "death cross" pattern below the "zero axis";
- Simultaneously, the "arbitrage trading model" synchronously issues a top warning signal.
Thus, we established a 15% short position at 62,679 USD.
Close position strategy:
- When the price falls to around 59,000 USD and stops falling, the K-line forms a "bottom head" signal;
- The "arbitrage trading model" triggers a strong bottom warning signal (red point + white point), and forms a bottom resonance signal with the "momentum quantitative model."
Therefore, we liquidated all at around 60,775 USD.
Summary: This trade successfully achieved a profit of approximately 3.03%.
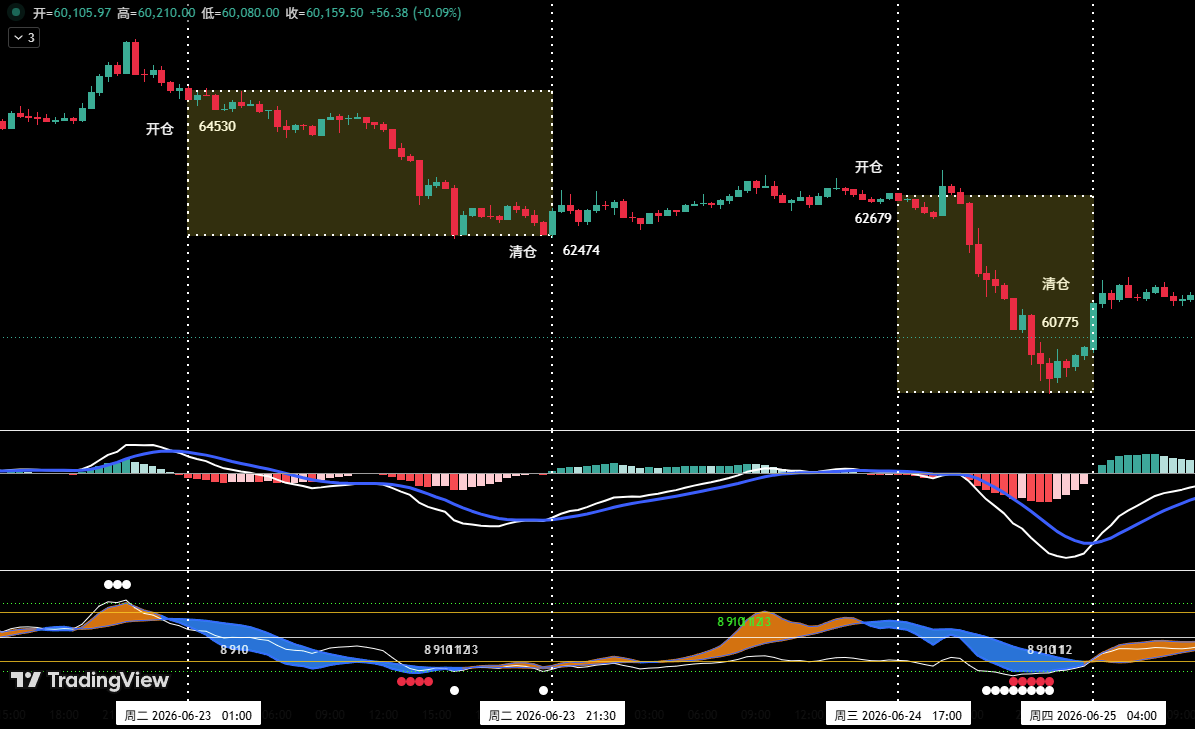 Figure 5 Short-term trading illustrations
6. Special reminders
- When opening a position: Immediately set the initial stop-loss position.
- When profit reaches 1%: Move the stop-loss position to the opening cost price (breakeven point) to ensure capital safety.
- When profit reaches 2%: Move the stop-loss position to the 1% profit position.
- Continuous tracking: After this, for every additional 1% profit, move the stop-loss position 1% accordingly, dynamically protecting and locking profits.
Risk warning:
The financial market is rapidly changing, and all market analyses and trading strategies need to be dynamically adjusted. All viewpoints, analysis models, and operational strategies discussed in this article are derived from personal technical analysis and are only for personal trading log purposes, not constituting any investment advice or operational basis. The market carries risks, and investment should be cautious; please do not base decisions on this.
免责声明:本文章仅代表作者个人观点,不代表本平台的立场和观点。本文章仅供信息分享,不构成对任何人的任何投资建议。用户与作者之间的任何争议,与本平台无关。如网页中刊载的文章或图片涉及侵权,请提供相关的权利证明和身份证明发送邮件到support@aicoin.com,本平台相关工作人员将会进行核查。


