Waves in the Currency Sea: June 30 Ethereum (ETH) Market Analysis Reference:
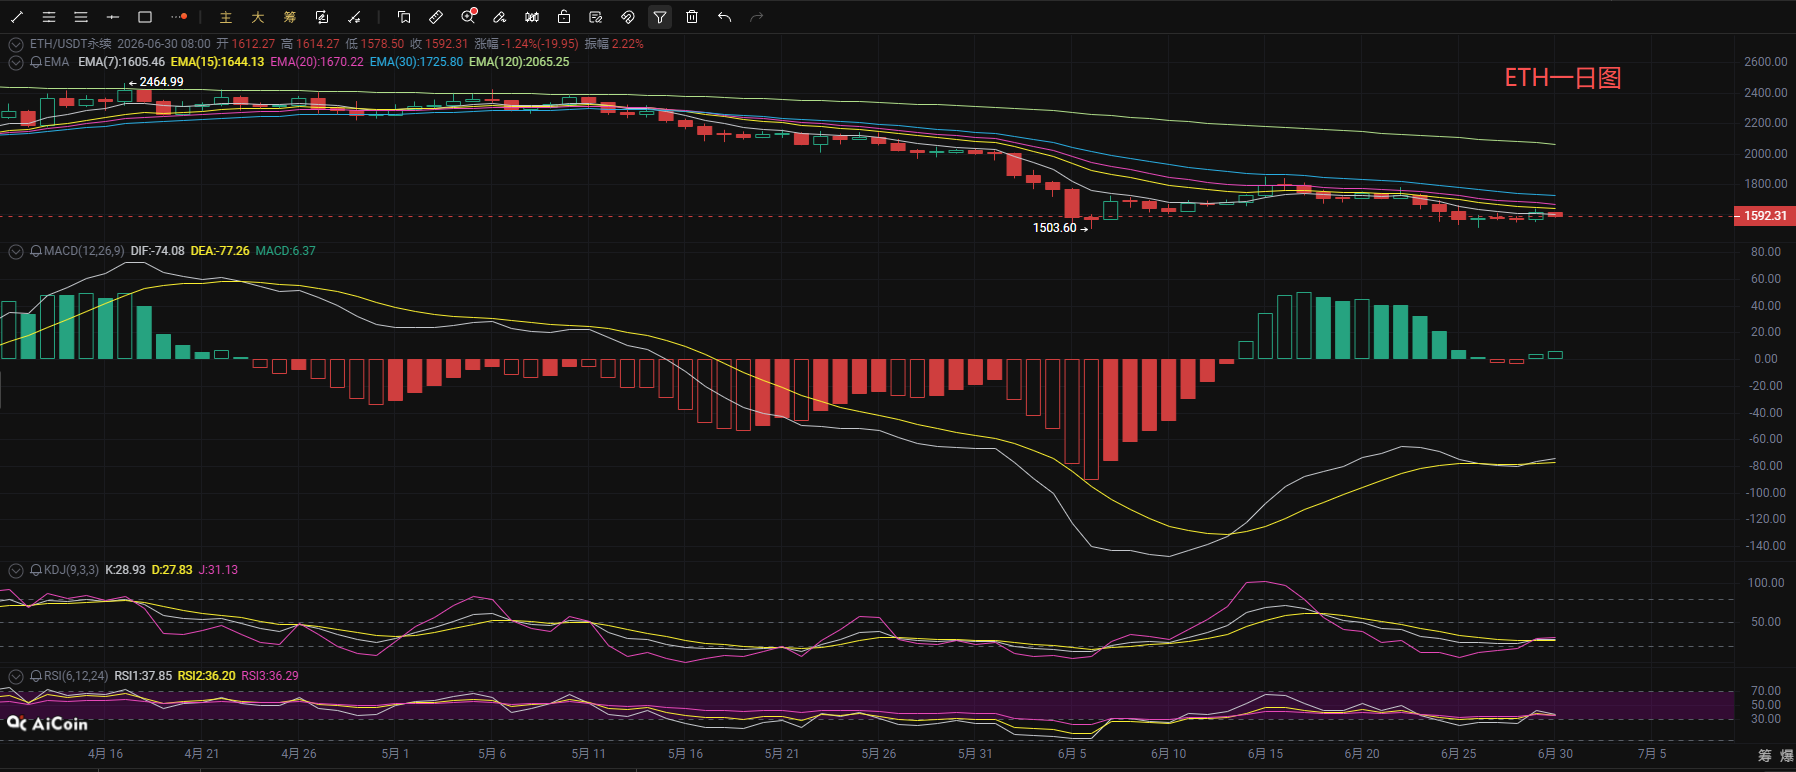
Ethereum encountered resistance and retreated after reaching the 1637 level early in the morning, with the current price running around 1590. The daily level is overall in a low consolidation range after a significant drop, with prices consistently under pressure below the middle Bollinger Band. All medium- and long-term EMA moving averages are arranged bearishly, suppressing the market from top to bottom, with heavy selling pressure above. The MACD maintains a weak bullish momentum above the zero axis, with the DIF crossing above the DEA forming a low-level golden cross; the KDJ three lines are entangled at a low level, and the upward rebound momentum is weak. The RSI is stable around 36, overall in a slightly weak neutral zone. The major trend at the daily level remains a weak consolidation after a decline, lacking incremental buying, with strong resistance at 1670 and support at 1530. As long as the support level is maintained, continued grinding could lead to an upward test of the middle band, opening up medium-term rebound space.
Short-term 4-hour chart shows significant range oscillation characteristics, with prices running near the middle Bollinger Band. The Bollinger Bands are continuously narrowing, compressing the volatility space, while short-term EMA moving averages are closely intertwined, with short-term costs for long and short positions tending to converge, showing no clear short-term direction. The MACD is above the zero axis, with bullish volume bars slightly retracting. The KDJ is in the middle axis range, forming a short-term death cross, indicating a slight pullback need; the RSI holds at a neutral position of 51, with no excessive overbought conditions. Short-term support is at 1555, and resistance at 1612. After confirming support at 1555 with a slight pullback, bulls are expected to regain strength, and a breakout above the upper band could initiate a short-term rebound.
Waves in the Currency Sea: June 30 Ethereum Short-term Reference:
Short Position: Sell in the 1675-1635 range, with a stop loss above 1725, target 1620-1560,
Long Position: Buy in the 1530-1560 range, with a stop loss below 1500, target 1580-1640,
Daily updates of real-time trading strategies, providing free resolution analysis and market operation knowledge. Scan the code to follow the public account for one-click access to add contact methods!

[The above analysis and strategies are for reference only. Please take responsibility for risks. The article's review and publication may have delays, and strategies may lack timeliness. Please do not operate blindly.]
免责声明:本文章仅代表作者个人观点,不代表本平台的立场和观点。本文章仅供信息分享,不构成对任何人的任何投资建议。用户与作者之间的任何争议,与本平台无关。如网页中刊载的文章或图片涉及侵权,请提供相关的权利证明和身份证明发送邮件到support@aicoin.com,本平台相关工作人员将会进行核查。