Crypto Circle Academician: Is the 7.2 Ethereum (ETH) fluctuation range about to face a breakout battle? Latest market analysis reference
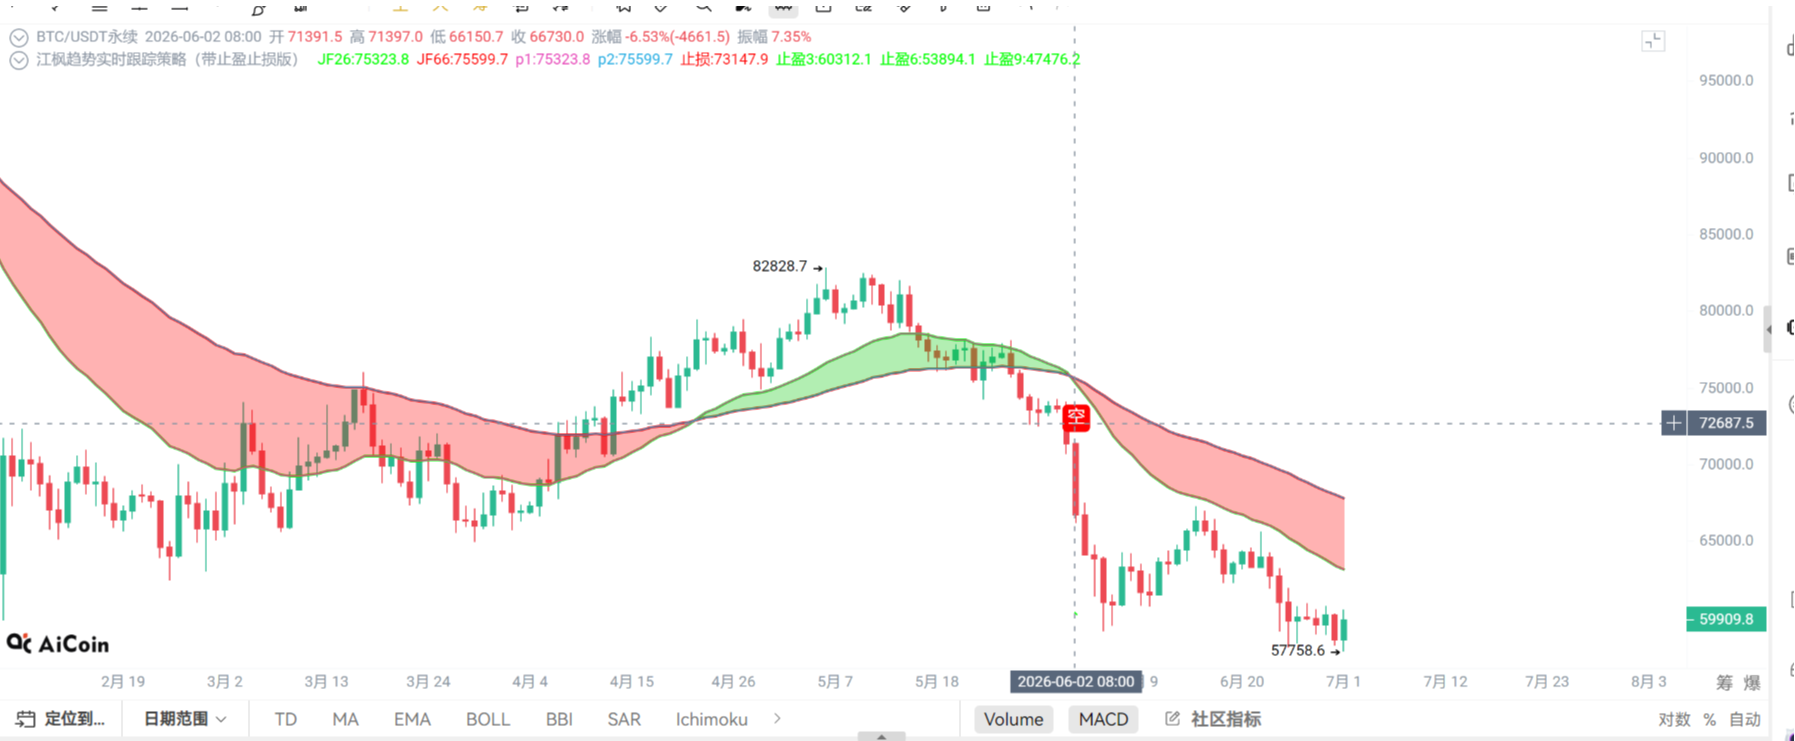
The current price of Ethereum is 1617, has it worn everyone's patience thin? The push upward is weak while there is support for the downward movement, being pulled back and forth, those holding positions watch their account numbers fluctuate repeatedly, while those without positions fear missing the bottom-fishing opportunity. In fact, what is most precious now is not the precise price points, but maintaining positions and mindset. Don’t let short-term ups and downs disrupt your rhythm; enduring through the fluctuations is the key to waiting for the trend. The market will not stay flat forever, what we need to do is not to fall in the darkness before dawn.
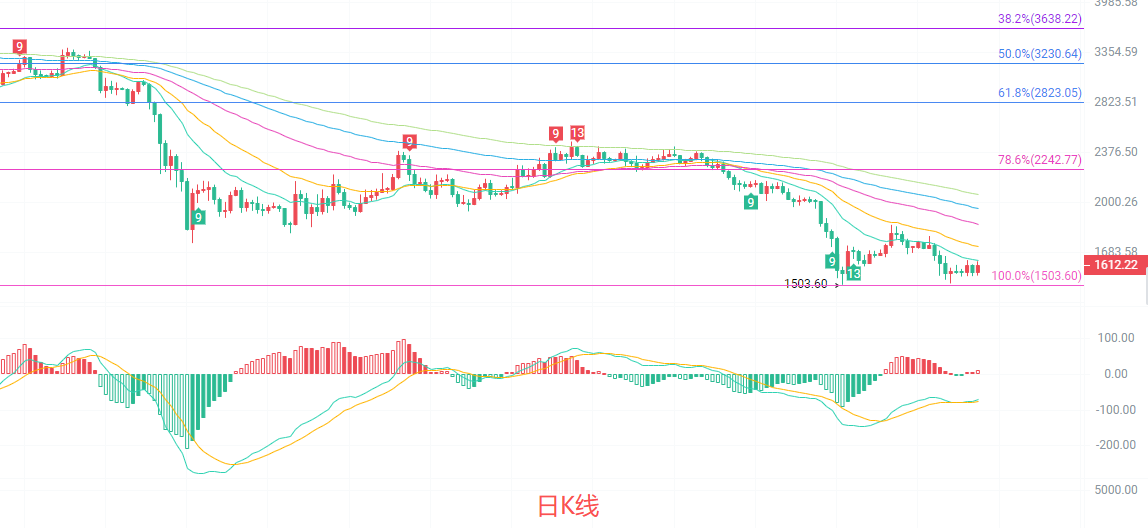
The daily candlestick is still in a clear descending channel, with the price pressured by short-term moving averages such as EMA15 and EMA30, forming a standard downward arrangement. The MACD indicator shows signs of a golden cross, but overall it is still running below the zero axis, indicating insufficient rebound momentum. The Bollinger Bands are opening downwards, and the price is running close to the lower track, showing that the downward force is still dominant. The Fibonacci 100% retracement level around 1503 is strong support, and recent rebounds have failed to break through the 1700 mark, indicating heavy selling pressure above, making it difficult to change the short-term trend.
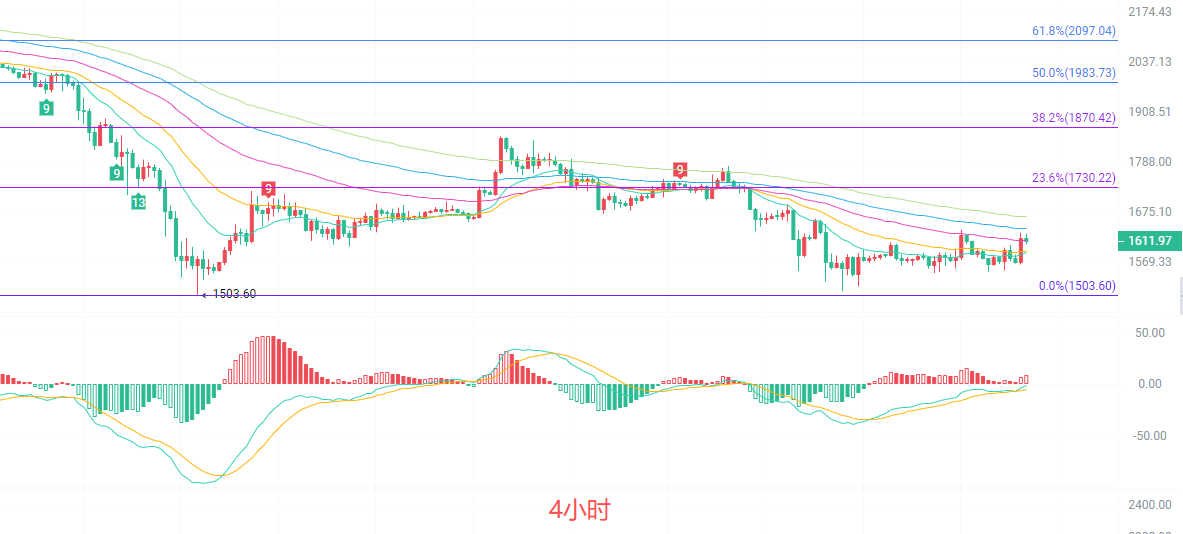
The four-hour candlestick is fluctuating and consolidating within the range of 1503-1680, with the moving average system in a sticky state, indicating that the short-term direction is not clear. The MACD indicator is near the zero axis, with the red bars shortening, showing that the upward momentum is waning. The Bollinger Bands are currently in a contracted state, indicating that the market is waiting for direction to choose. The upper Fibonacci level around 1730 at 23.6% is a key resistance level, while the lower support is near 1550 at the lower track of the Bollinger Bands. The price is currently near the mid-range, and the bulls and bears are in fierce contention, with a high probability of maintaining a weak fluctuating trend in the short term.
Short-term reference:
If it does not break below 1530 to 1500, aim for upward, stop loss at 1470, target at 1570 to 1630
If it does not break above 1680 to 1720, aim for downward, stop loss at 1750, target at 1600 to 1550
Specific operations should be based on real-time market data; for more information, you can consult the author. The article may have a delay in publication; it is suggested for reference only and the risk is borne by oneself.

Friendly reminder: The above content is solely created by the author of the public account. The ads at the end of the article and in the comments section are unrelated to the author. Please discern carefully, thank you for reading.
免责声明:本文章仅代表作者个人观点,不代表本平台的立场和观点。本文章仅供信息分享,不构成对任何人的任何投资建议。用户与作者之间的任何争议,与本平台无关。如网页中刊载的文章或图片涉及侵权,请提供相关的权利证明和身份证明发送邮件到support@aicoin.com,本平台相关工作人员将会进行核查。