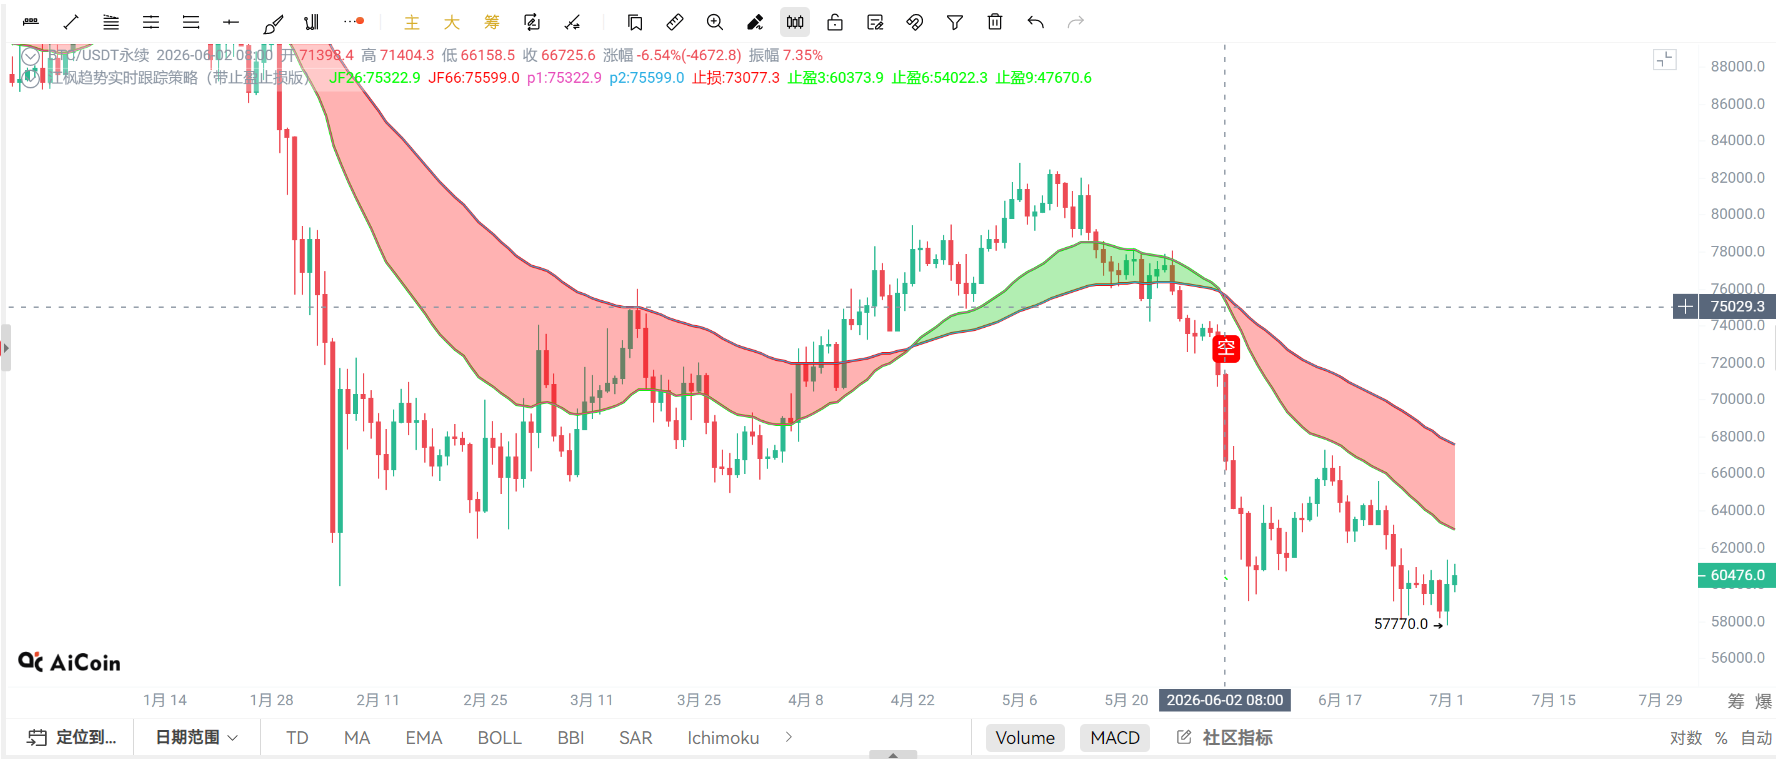
July welcomes a good start, as yesterday Bitcoin's daily line closed with a solid bullish candle. Although there was a high surge followed by a pullback during the day, it ultimately maintained the bullish candle body, indicating that the funds at lower levels are gradually strengthening. Compared to the previous continuous downward trend, market sentiment has improved, and the bottom structure is slowly rising.
However, the overall direction has not changed. The market is still operating in a bearish trend, but after a long period of decline, the bearish momentum is gradually diminishing. No trend will only decline without rising; when the market enters an extremely pessimistic phase, it often indicates the accumulation of reversal conditions begins.
From a cyclical perspective, daily, weekly, and monthly lines are gradually entering bottom regions, which makes the low absorption strategy after a sharp drop still have a higher profit-to-loss ratio. Although the upper pressure remains dense, capital has started attempting to position itself at the bottom, and bullish forces are quietly accumulating. The real major battle between bulls and bears may be getting closer.
The overall judgment for July remains unchanged: **If July cannot close positively, then the probability of August closing positively will significantly increase.** July, as the first month of the second half of the year, is also an important observation window for the market's transition from weak to strong. Whether it can complete the transition from bearish to bullish will determine the operational rhythm for the following months.
Bitcoin (BTC)
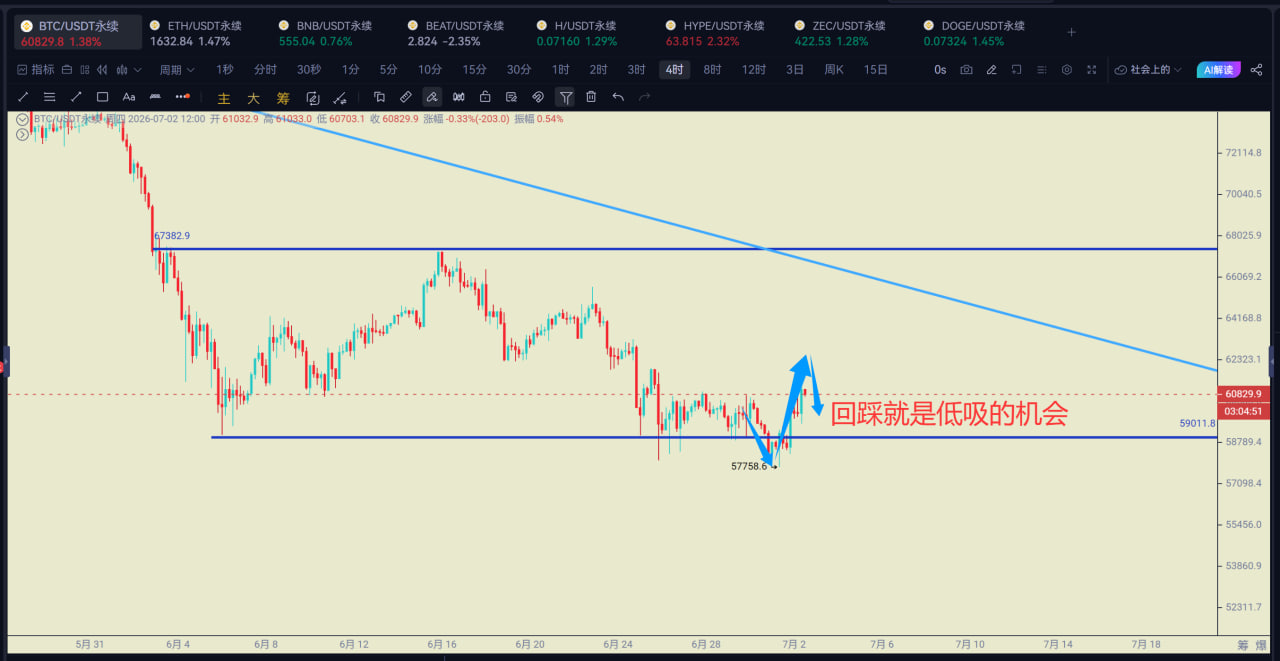
Short-term trends are starting to improve, generally leaning towards slight bullish consolidation.
On the funding side, the U.S. spot Bitcoin ETF has seen net redemptions for 13 consecutive trading days, with a cumulative net outflow of about $4.4 billion, indicating that institutional funds remain cautious. However, at the same time, market sentiment has plunged into the extreme fear area, with the Fear and Greed Index only at 16. Historically, whenever sentiment reaches this level, it often means the market is not far from a phase bottom.
From a technical perspective, the pressure after breakouts at the 1-hour and 2-hour levels has gradually turned into support; although the 4-hour line has pulled back somewhat after the breakout, it remains in a key contention zone. As long as the support below can be consistently held, there is still potential for further development of the short-term corrective trend.
Overall, the market is still in a bottoming phase rather than a reversal phase. What is truly worth paying attention to is not the daily fluctuations, but whether funds are beginning to flow back continuously and whether multiple cycles can achieve synchronous resonance. Once the daily, weekly, and monthly lines complete their resonance, the market may welcome one of the most important trend rallies in the second half of this year.
Support levels to watch: 59100-59700
Resistance levels to watch: 60400-60700, 60928, 61500
Tencent Meeting 24-hour live stream: 759-223-4196

This article is originally published by 【Huiying Community】 and only represents personal views. Due to the inherent delay in information transmission, the content is for reference only and does not constitute any investment advice. Please make rational judgments and operate cautiously.
If you need to obtain more timely daily market analysis and strategy ideas, you are welcome to add Safew's contact information or add three lines: MY89080, to join the group for free learning.
Our community has 15 professional analysts monitoring the market live all day. Here you can not only learn practical technical analysis methods but also systematically understand strategies for position recovery and risk control systems.
免责声明:本文章仅代表作者个人观点,不代表本平台的立场和观点。本文章仅供信息分享,不构成对任何人的任何投资建议。用户与作者之间的任何争议,与本平台无关。如网页中刊载的文章或图片涉及侵权,请提供相关的权利证明和身份证明发送邮件到support@aicoin.com,本平台相关工作人员将会进行核查。