Cryptocurrency Scholar: Is the Current Rebound of 7.5 Ether (ETH) a Trap or a Reversal? Latest Market Analysis Reference
The current price of Ether is 1790, don't shout bull market as soon as it rises. The overall trend on the daily chart is still bearish, there are layers of moving average resistance above, making each step very laborious. If you are trading short term, get in and out quickly, don't be too ambitious, and managing your stop-loss is more important than anything else. After all, market sentiment is unstable, and a news-driven fluctuation can undermine the rebound. Stay stable and don't be greedy.
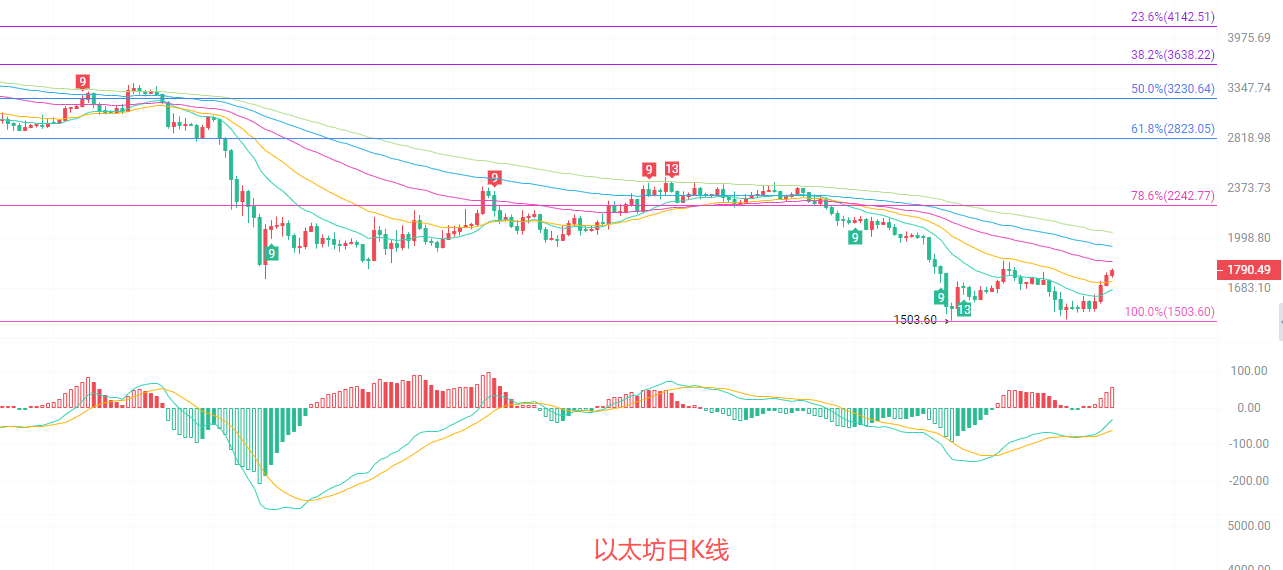
The daily K-line is sitting above the EMA15 moving average of 1674, but is still constrained by the EMA30/60 and other mid-term moving averages, overall in a corrective phase after a downtrend. The MACD indicator shows that the DIF crosses above the DEA, and the green bars turn red, with downward momentum diminishing, but the red bar's volume is still weak, and a strong confirmation of upward movement has not been formed yet. The middle rail of the Bollinger Bands is continuously declining, the price has just broken through the middle rail around 1677, the upper rail at 1838 forms short-term resistance, and the lower support is at 1503.
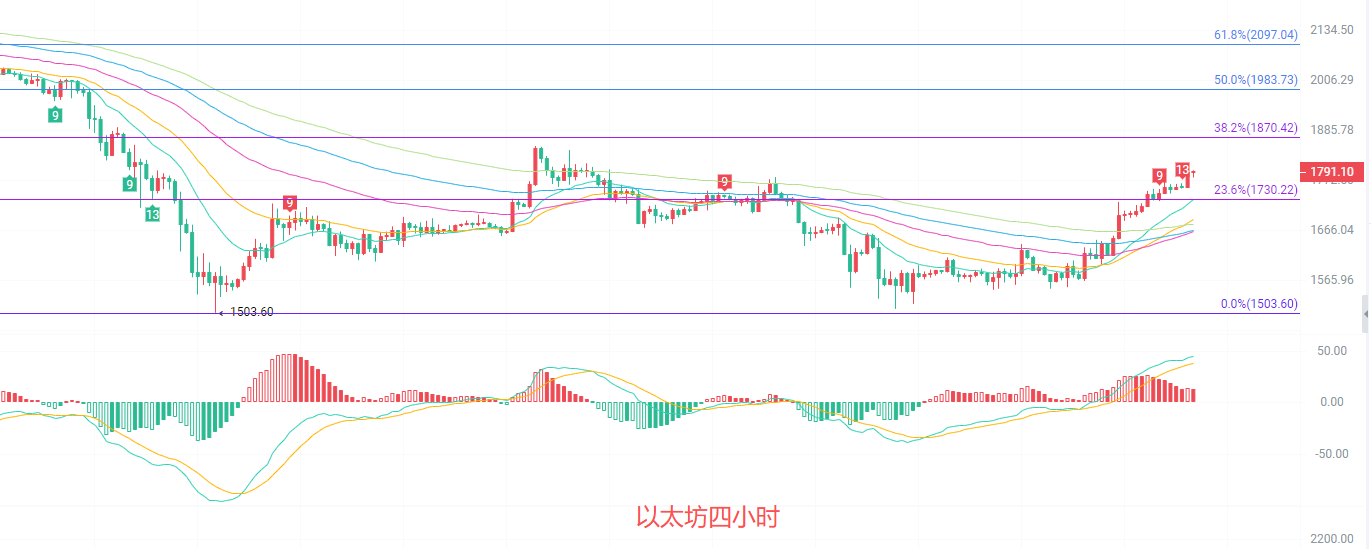
The four-hour K-line has shown a rebound, with the price stabilizing above the EMA15/30 short-term moving averages, and the moving averages turning upwards forming a short-term upward arrangement. The MACD indicator shows a consistent increase in red bars, and the DIF is operating above the zero axis, with upward momentum still being released, making the short-term trend relatively strong. The Bollinger Bands are opening upwards, with the price operating near the upper rail, and short-term overbought signals beginning to appear, requiring caution against retracement risks. The key resistance above is located at the Fibonacci 23.6% level of 1730, and the support below is at the EMA30 moving average of 1689.
Short-term Reference:
If it doesn't break below 1750 to 1700, go long, stop loss at 1660, target at 1820 to 1870.
If it doesn't break above 1850 to 1880, go short, stop loss at 1910, target at 1800 to 1750.
Specific operations should be based on real-time data from the market, for more detailed information consult the author, the publication of this article has a delay, and it is advised as a reference, the risk is borne by you.

Warm Reminder: The above content is solely created by the author of the public account, advertisements at the end of the article and in the comments section are not related to the author, please discern carefully, thank you for reading.
免责声明:本文章仅代表作者个人观点,不代表本平台的立场和观点。本文章仅供信息分享,不构成对任何人的任何投资建议。用户与作者之间的任何争议,与本平台无关。如网页中刊载的文章或图片涉及侵权,请提供相关的权利证明和身份证明发送邮件到support@aicoin.com,本平台相关工作人员将会进行核查。