Friends, I am Sister Qinglan. Today, July 6th, let's focus on two major news points in the market analysis. First, Citibank has clearly stated that the reasons for interest rate hikes have disappeared, and it is expected that the Federal Reserve will restart rate cuts in October, injecting strong expectations for liquidity easing into the market, which is a typical strong positive signal. Second, the Bitcoin bottom-fishing index AHR999 has fallen to 0.32, nearing historical lows, while the miner pressure index has set a new low for 2026, indicating the emergence of historical bottom features. The combination of these two pieces of information suggests that the current market is in a stage of extreme pessimism but highlights long-term allocation value; short-term sentiment and long-term logic are in fierce contention.
Current price and time
The current time is July 6th, 09:47, and the Bitcoin price is 63680 USDT. The 24-hour increase is 1.44%, but the fear and greed index is only 24, indicating extreme fear. Market sentiment is at a freezing point, yet the price has slightly rebounded, which is a divergence worth noting.
Multi-timeframe status overview
First, let’s look at the daily level. MA5 is at 62923, MA10 is at 61313, and the price is above these two moving averages, with short-term averages showing signs of flatlining. The MACD's DIF is -992.02, DEA is -1702.06, and the histogram is 710.03. Although the DIF is still below the zero line, the histogram continues to expand, indicating a decline in downward momentum. The RSI is at 48.63, in the neutral weakness area. Overall, the daily chart shows a bottom oscillation recovery structure.
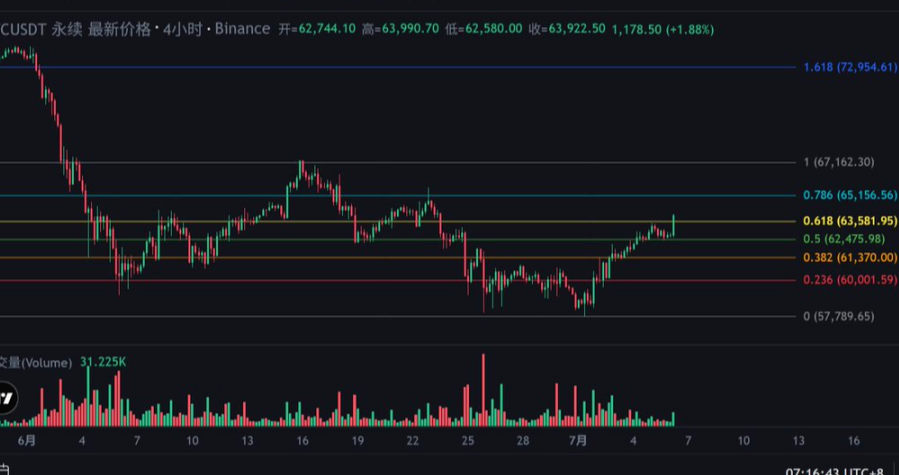
At the 4-hour level, MA5 is at 63099, MA10 is at 63066, and MA30 is at 61836, with the price running above all moving averages. The MACD forms a golden cross, with DIF at 668.16, DEA at 654.78, and the histogram at 13.38, indicating a clear golden cross signal. The RSI is 70.80, close to the overbought area, but not yet overheated. The 4-hour chart presents a bullish rebound pattern.
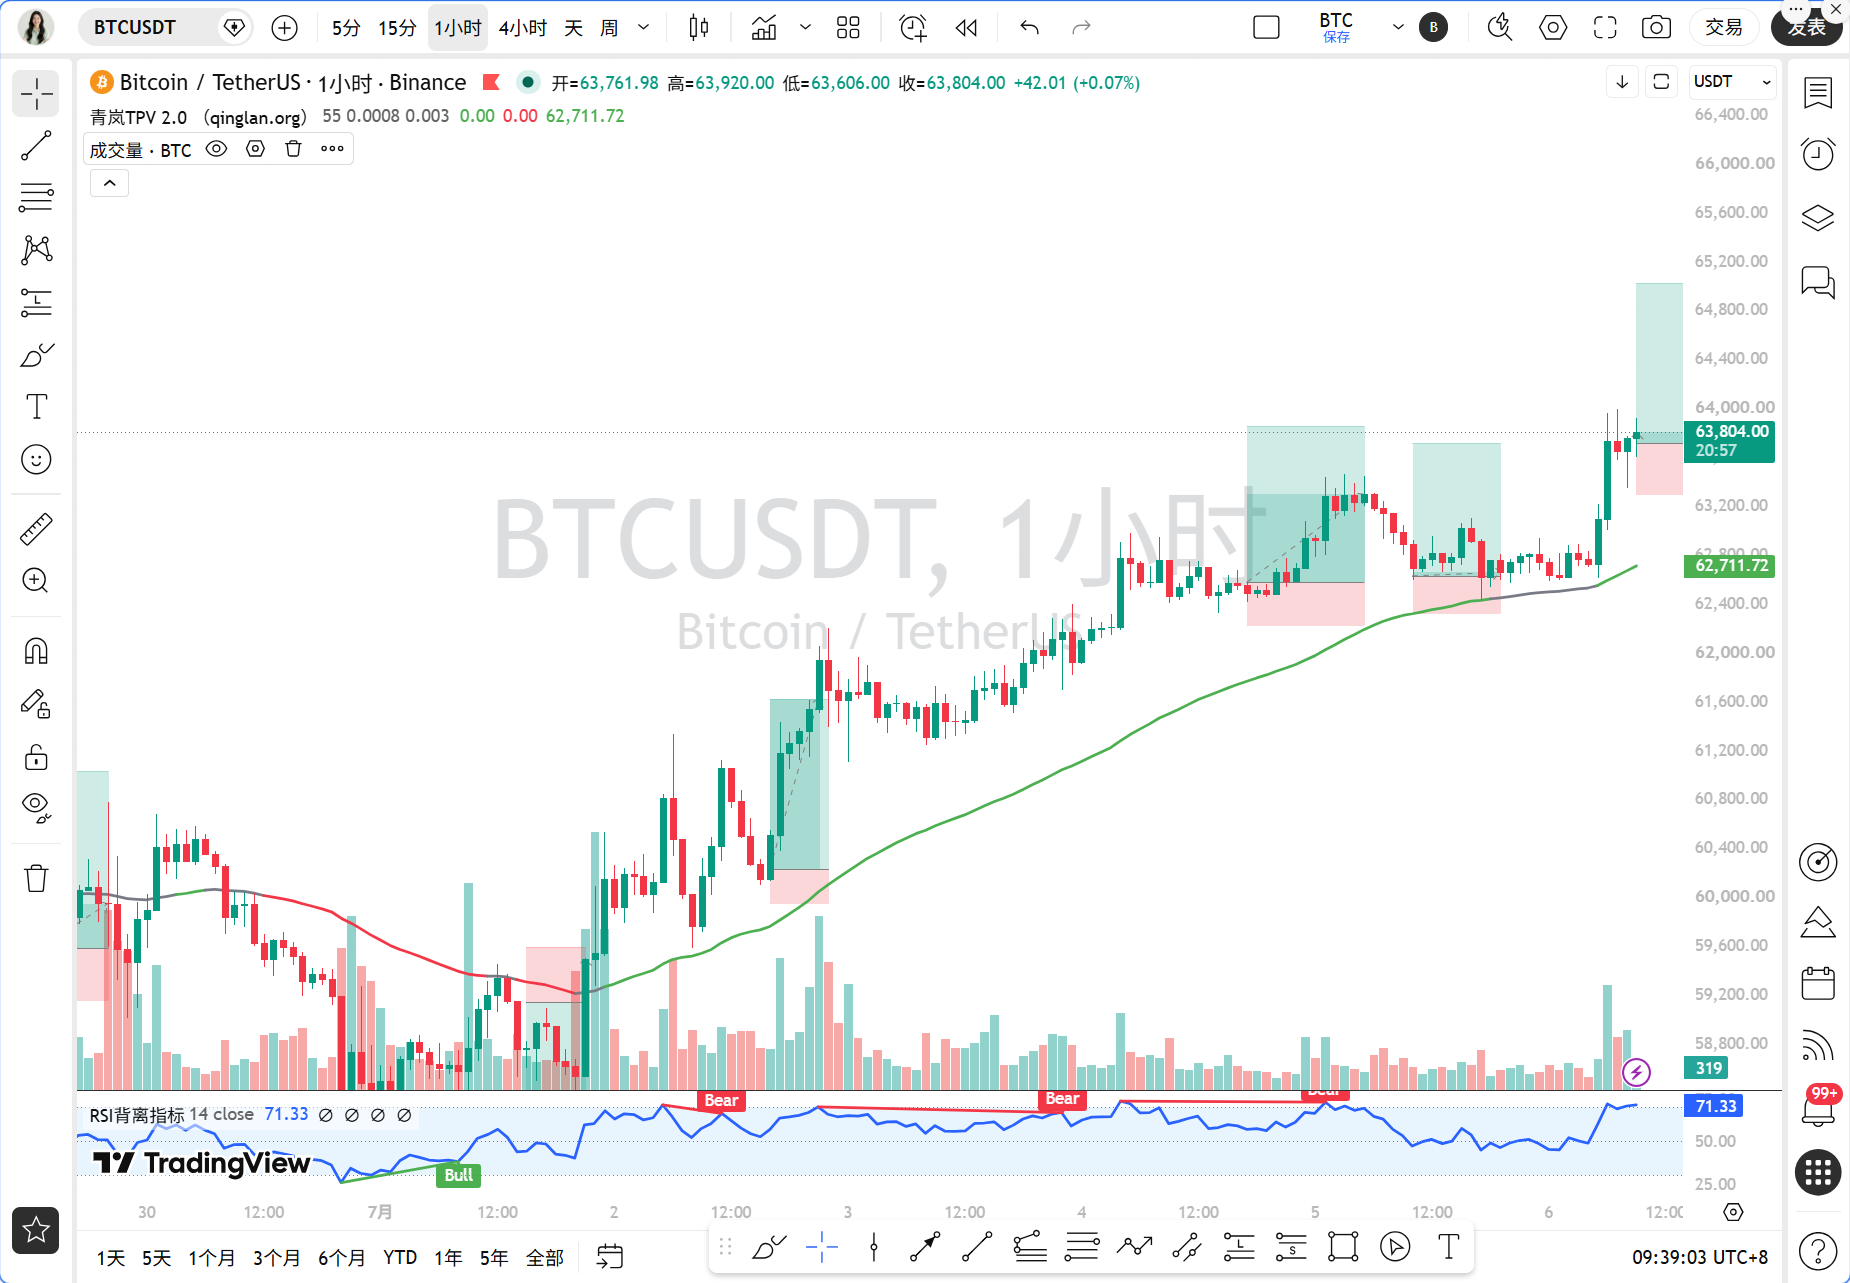
At the 1-hour level, MA5 is at 63584, MA10 is at 63150, and MA30 is at 62970, with the price moving along MA5 upward. The MACD's DIF is 211.27, DEA is 100.81, and the histogram is 110.46, showing strong bullish momentum. The RSI is at 76.71, entering the overbought area, indicating a short-term need for a pullback. EMA55 is at 62788.85, and the price is far above this line, confirming a clear bullish trend.
At the 15-minute level, MA5 is at 63742, MA10 is at 63668, and MA30 is at 63271, with the price oscillating near MA5. The MACD's DIF is 211.87, DEA is 222.53, and the histogram is -10.66, displaying a bearish cross signal, indicating a decrease in short-term momentum. The RSI is at 48.88, neutral. The 15-minute chart shows short-term pullback pressure.
TPV signal validation
According to the Qinglan TPV system, we use the 1-hour EMA55 as the boundary between long and short positions. The current price of 63680 is well above EMA55 at 62788.85, by 1.42%, which falls into the bullish trend area. In the last 8 hourly candlesticks, the closing price was above EMA55 6 times, with 2 crosses, not meeting the oscillation threshold, indicating the current single-sided bullish trend.
Conditions for going long. First, the price remains above the 1-hour EMA55, with the closing price above EMA55 for 2 consecutive candlesticks, meeting the conditions. Second, support shows stability, as the price rebounded from around 62700, forming a bottom division structure, meeting the conditions. Third, the downward momentum has weakened, with the MACD histogram continuing to expand at the 1-hour level, but the RSI has risen from below 30 to 76, indicating a noticeable momentum switch, meeting the conditions. In summary, the bullish signal is valid.
Conditions for going short are not yet met, as the price is above EMA55 and there have been no consecutive 2 candlesticks closing below EMA55.
On-chain capital situation
In terms of on-chain data, the fear and greed index is at 24, indicating extreme fear, which historically often corresponds to stage bottoms. BTC market share is 55.79%, showing that funds are still seeking refuge in Bitcoin. The funding rate has rebounded, indicating a reduction in bearish sentiment, but bulls have not fully returned. Large short positions have increased, with Hyperliquid's most profitable address adding a 2 million short position, with 98.5% of the position short, creating potential short squeeze risks. The miner pressure index has set a new low for 2026, indicating a historically undervalued range, with strong long signals from a long-term perspective.
Key support and resistance levels
The key resistance above is at the integer level of 64000, which is a psychological pressure point as well as a previous area of concentrated transactions. If broken, the next target is at 65000. The key support below is at 63000, which is where the 1-hour MA10 and the 4-hour MA5 converge. If broken, the next support is at 62300, near the 1-hour EMA55. In extreme cases, if market sentiment deteriorates, 61500 serves as the defensive level for the daily MA10.
Trading ideas
Direction: the current 1-hour EMA55 bullish trend is clear, but RSI is overbought; therefore, it is not advisable to chase highs in the short term. It is recommended to wait for a pullback to stabilize before going long and not to actively short.
Entry conditions: the price pulls back near 1-hour EMA55, in the range of 62700-63000, while showing a long lower shadow or bottom division structure, and MACD histogram shortens or RSI falls back from the overbought area to around 50. After meeting the conditions, a small position can be taken to go long.
Stop loss level: set below 62300, under the daily MA10, to prevent false breaks or trend reversals.
Target level: the first target is 64000, and the second target is 65000. If the price breaks through 64000 with volume, additional positions can be added to target 65500.
Risk warning
The current market sentiment is extreme, with large whales concentrating on short positions; caution is needed for potential severe fluctuations in the short term, and strict stop losses should be implemented.
Follow Qinglan’s cryptocurrency classes to seize more trading opportunities! Welcome to visit the official website www.qinglan.org
📊 Qinglan TPV trading strategy backtesting reference
🕒 Last backtesting time: 07-06 07:00:02
Total analysis: 2747 Backtests: 2139 Accuracy: 74.5% (1594/2139)
免责声明:本文章仅代表作者个人观点,不代表本平台的立场和观点。本文章仅供信息分享,不构成对任何人的任何投资建议。用户与作者之间的任何争议,与本平台无关。如网页中刊载的文章或图片涉及侵权,请提供相关的权利证明和身份证明发送邮件到support@aicoin.com,本平台相关工作人员将会进行核查。