Dear friends, I am Sister Qinglan. Today, July 7th market situation, we must start from two heavy news. First, BlackRock swept 300 BTC and 7456 ETH in 10 minutes, which is a direct purchase by the world's largest asset management company, injecting a booster into the market and directly pushing BTC to break through the $63,000 mark. Second, the Nasdaq-listed company Empery Digital increased its holdings by 1200 bitcoins in 6 days, showing that institutions continue to increase their holdings, indicating long-term bullish confidence. These two strong bullish signals sharply contrast with the current market fear and greed index of 27, indicating that retail investors are panicking while institutions are accumulating, which is a typical characteristic of a bottom area. On the other hand, Strategy sold 3588 BTC last week at a loss of $55 million, along with the Federal Reserve's hawkish remarks, casting a shadow over the short-term rebound. We must look for answers in the data.
Current price and time
The current time is July 7th, 09:37, BTC price is 63836 USDT, with a 24-hour increase of 0.66%. The price has stabilized above the $63,000 mark, but we need to confirm through multi-timeframe analysis whether this is a rebound or a reversal.
Multi-timeframe status overview
First, look at the daily chart. Daily MA5=63451, MA10=61730, MA30=62647, the price of 63836 is above all moving averages. MACD column is 745.52, DIF=-758.04, DEA=-1503.56. Although DIF is still negative, the MACD column has been positive and expanding continuously, indicating an exhaustion of downward momentum, with bulls accumulating. RSI=54.70, in a neutral to strong area, not overheated.
4-hour timeframe. 4-hour MA5=63529, MA10=63318, MA30=62559, the price is also above the moving averages, MACD column=8.49, DIF=613.21, DEA=604.73, DIF is above DEA, although the MACD column is very small, it is positive, indicating mild bullish momentum. RSI=55.35, also neutral to strong.
1-hour timeframe. 1-hour MA5=64163, MA10=63939, MA30=63304, the price of 63836 is below MA5 but above MA10 and MA30, MACD column=96.17, DIF=316.95, DEA=220.77, DIF is above DEA, the MACD column is positive and large, indicating strong bullish momentum in 1 hour. RSI=64.28, close to the overbought area but not reached.
15-minute timeframe. 15-minute MA5=64007, MA10=64051, MA30=64017, the price of 63836 is below all moving averages, MACD column=-73.84, DIF=81.27, DEA=155.11, DIF is below DEA, the MACD column is negative, RSI=30.38, close to oversold. The 15-minute chart indicates short-term pullback pressure.
Summary: The daily and 4-hour bullish trends are clear, 1-hour bullish momentum is strong, but the 15-minute chart shows a pullback signal, indicating short-term profit-taking demand, but the larger timeframe support is strong.
TPV signal verification
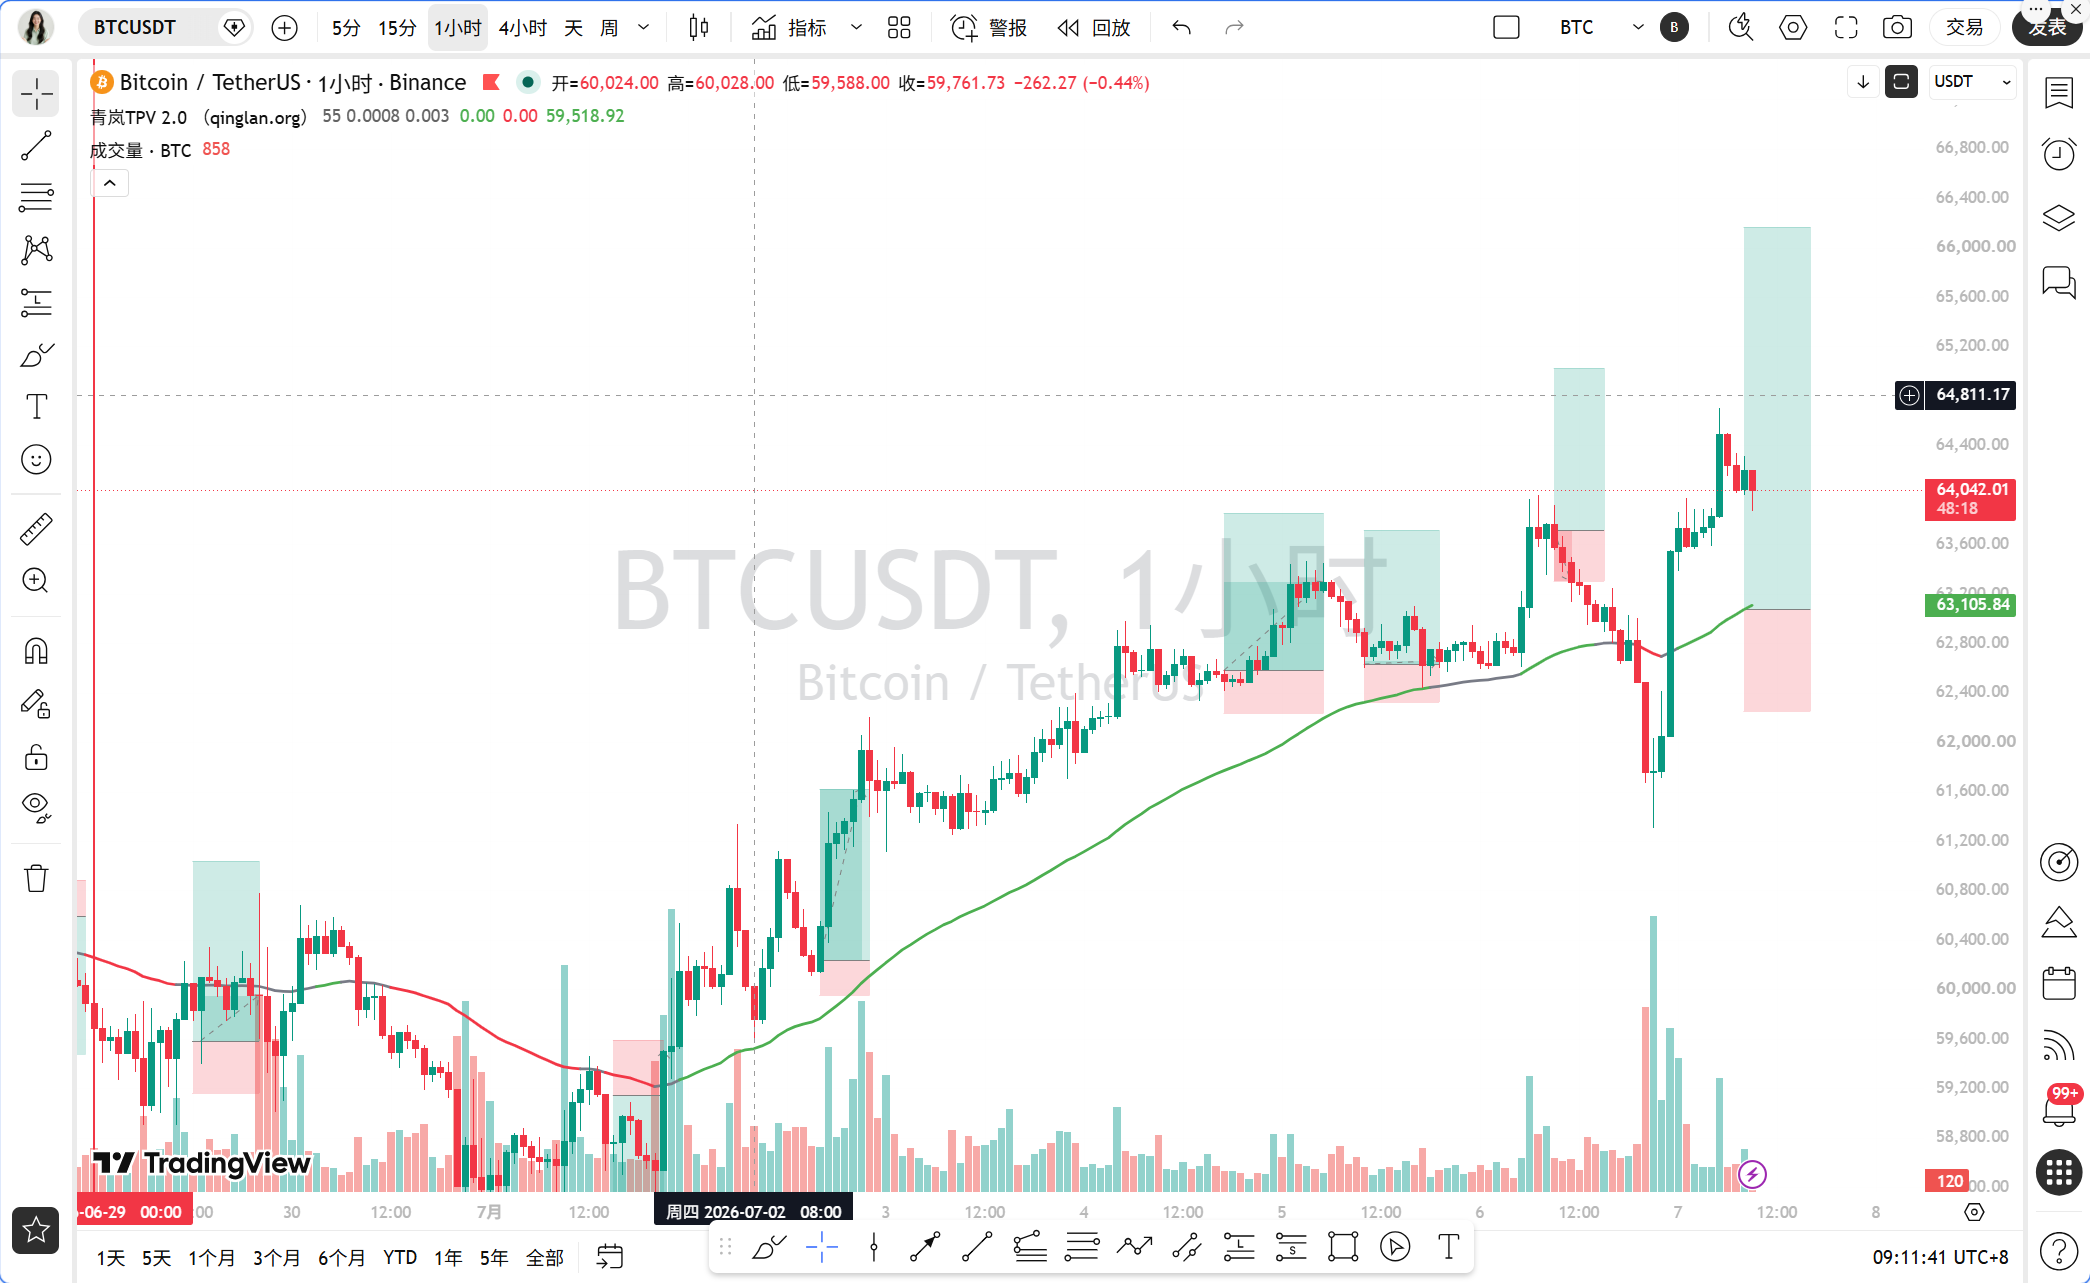
Now, use the Qinglan TPV system for verification. 1-hour EMA55=63155.90, current price 63836, above EMA55. In the past 8 1-hour candles, the closing price was greater than EMA55 eight times out of eight, with zero crossings, and the price distance from EMA55 is 1.08%, not meeting the oscillation threshold, in a unilateral bullish trend.
Long position condition check. Condition 1: Price stabilizes above 1-hour EMA55, with two consecutive 1-hour candle closing prices greater than EMA55. From the data, the past 8 candles were all greater than EMA55, meeting the condition. Condition 2: Support steady. We need to see if there are long lower shadows or bottom formations. The current price rebounded from around 63000, touching an effective low before rebounding, and the trading volume increased, satisfying the condition. Condition 3: Downward momentum exhaustion. The MACD column on the 1-hour chart is positive and continuously expanding, RSI has risen from around 30 to 64, satisfying the condition. Therefore, the TPV system gives a long signal.
Short position condition check. Condition 1: Price is under pressure below 1-hour EMA55, not satisfied. Condition 2: Pressure meets resistance, not satisfied. Condition 3: Weak rebound, not satisfied. Therefore, the short position conditions do not hold.
On-chain/funding situation
On-chain data, fear and greed index is 27, which belongs to extreme fear, this usually indicates the market bottom area. BTC market share is 55.92%, indicating BTC's dominant position is stable. On the funding side, BlackRock and Empery Digital's increases are direct positives, but Strategy's selling and the Federal Reserve's hawkish remarks create a hedge. Overall, institutional capital inflow is greater than outflow, but retail sentiment is low; the market is in a divergent phase.
Key attack and defense positions
Key resistance above: 64500-65000 area, this is the previous high point, and also near 4-hour MA120. If broken, the next target is at 66000. Key support below: 63155, namely 1-hour EMA55, this is the dividing line between bulls and bears. If broken, it may retrace to the 62000-62500 area. Additionally, the 63000 integer mark is also a psychological support.
Trading idea
Direction: Bullish. Based on the TPV system signal, it is currently in a unilateral bullish trend, all long condition met.
Entry condition: Wait for the 15-minute timeframe pullback to stabilize. It is suggested to enter in batches in the range of 63500-63800. If the price retraces to around 1-hour EMA55 near 63155-63300 area, additional positions can be added. Note, do not chase high, as the 15-minute RSI is close to overbought but has not reversed; waiting for the 15-minute MACD column to turn from negative to positive or a bottom formation to appear.
Stop loss position: Set uniformly below 62800, if it breaks below 1-hour EMA55 and two consecutive candle closing prices are below EMA55, then stop loss. If the price breaks below 63000, also be cautious.
Target position: First target 64500, second target 65000, third target 66000. If it breaks 65000, it can be held for higher.
Risk reminder
The Federal Reserve's hawkish remarks and Strategy's selling may trigger a short-term pullback; be sure to control positions and do not over-leverage.
Follow Qinglan Crypto Classroom, let’s grasp more trading opportunities together! Welcome to visit the official website www.qinglan.org
📊 Qinglan TPV trading strategy backtest reference
🕒 Last backtest time 07-07 07:00:01
Total analysis: 2771 Backtest: 2150 Accuracy: 74.7% (1605/2150)
免责声明:本文章仅代表作者个人观点,不代表本平台的立场和观点。本文章仅供信息分享,不构成对任何人的任何投资建议。用户与作者之间的任何争议,与本平台无关。如网页中刊载的文章或图片涉及侵权,请提供相关的权利证明和身份证明发送邮件到support@aicoin.com,本平台相关工作人员将会进行核查。