Market Waves: 7.7 Ethereum (ETH) Market Analysis Reference:
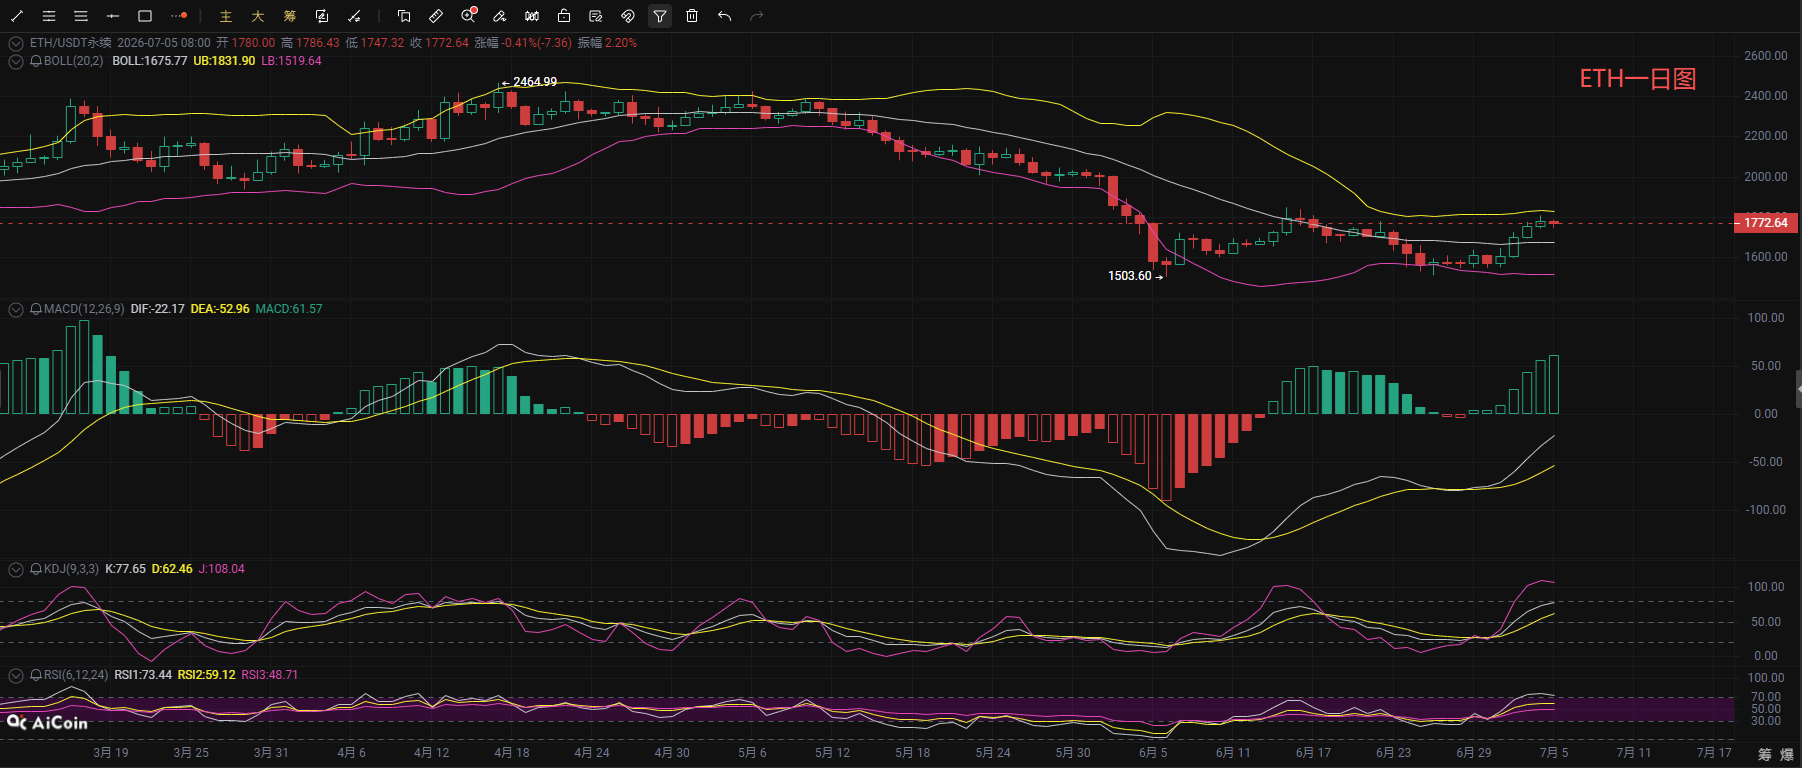
Ethereum has once again surged to a high and faced pressure, currently priced at 1780. The daily chart shows that the price is firmly above the middle band of the Bollinger Bands, with the channel slowly opening upwards. The MACD indicator's fast and slow lines have formed a golden cross below the zero axis and are continuing to diverge upwards with increasing volume, indicating a steady rise in bullish momentum. However, the KDJ three lines have entered the high region, the J value is close to the overbought threshold, and the RSI is approaching the critical point of 70, with the price also reaching the upper band of the Bollinger Bands, indicating a technical pullback demand in the short term. The market will first experience a shakeout and a retreat to digest bullish profit positions, testing short-term moving average support before stabilizing and then testing upper pressure. Overall, this is a recovery market after a significant decline, and the medium-term downtrend has not been completely reversed.
In the short-term 4-hour chart, the price encountered resistance at the high point of 1833 and retreated. The MACD is gradually shortening, with both lines diverging downwards, and the short-term bullish momentum has significantly weakened. The KDJ has formed a dead cross and is moving downwards, while the RSI has fallen from high levels to a neutral zone, with the Bollinger Bands closing. The price has retreated to above the middle band and is oscillating. In the short term, a slight pullback will occur first to confirm the support of the Bollinger Bands middle band and the EMA moving average. If support holds, then it will oscillate upwards again. If the moving average support is broken, it will test further down to the 1750 level. The recommended approach is to sell high and buy low based on resistance and support levels.
Market Waves: 7.7 Ethereum Short-term Reference:
Short positions: Sell in the range of 1835-1805, stop loss above 1855, target at 1770-1720,
Long positions: Buy in the range of 1715-1745, stop loss below 1675, target at 1770-1800,
Daily updates on real-time trading strategies, providing free analysis and market operational knowledge. Scan the code to follow the official account for a quick connection and addition method!

The above analysis and strategies are for reference only; please bear the risks yourself. The article review and publication may have delays, and strategies do not possess timeliness. Do not operate blindly.
免责声明:本文章仅代表作者个人观点,不代表本平台的立场和观点。本文章仅供信息分享,不构成对任何人的任何投资建议。用户与作者之间的任何争议,与本平台无关。如网页中刊载的文章或图片涉及侵权,请提供相关的权利证明和身份证明发送邮件到support@aicoin.com,本平台相关工作人员将会进行核查。