Cryptocurrency Academic: The first rebound after the drop to 7.8 Bitcoin (BTC), historical data tells you how to proceed! Analysis of the latest market situation and operation suggestions.
Currently, Bitcoin is at 64100, the market is built on actual movements, not guesses. If you don’t even have a stop loss, how is that different from entering the market naked? Many fans asked yesterday whether they should hold on after dropping to 59000. Now at 64000, holding firm against a 5000-point shift is not something ordinary people can do. I suspect that this wave of ultra-low positioning is mostly from those who followed the market's shout for a waterfall entry, and such emotional operations, if you lose, who else should you blame?
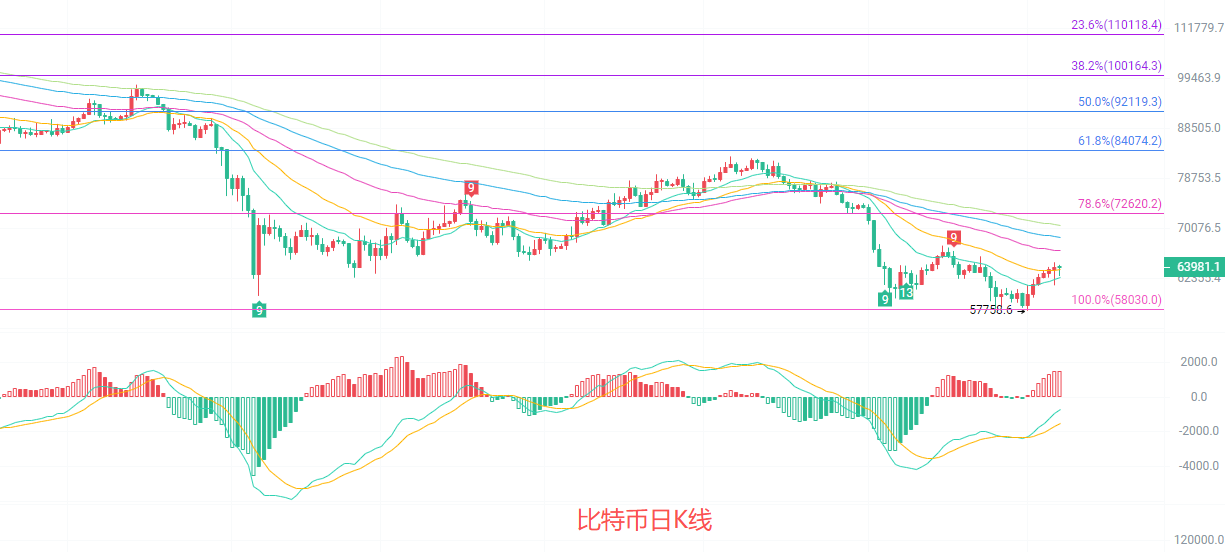
The daily K-line is rebounding from a previous low of 57758, currently just above the EMA15/30 moving averages, which is the first sign of stabilization after a downtrend. The middle line of the Bollinger Band is at 61947; the price is above the middle line, indicating a short-term trend shift from weak to strong. The upper line is at 65568, the lower line at 58325, with the range gradually narrowing, indicating a direction choice is imminent. In terms of MACD, the DIF is crossing above the DEA from below, with the red bars continuing to expand, and upward momentum is recovering. However, the upper EMA60/90 moving averages are in the range of 66500-68600, facing strong pressure. The rebound has not yet broken the downward trend line, and overall it is still in a recovery phase after the decline, not yet entering a clear reversal trend.
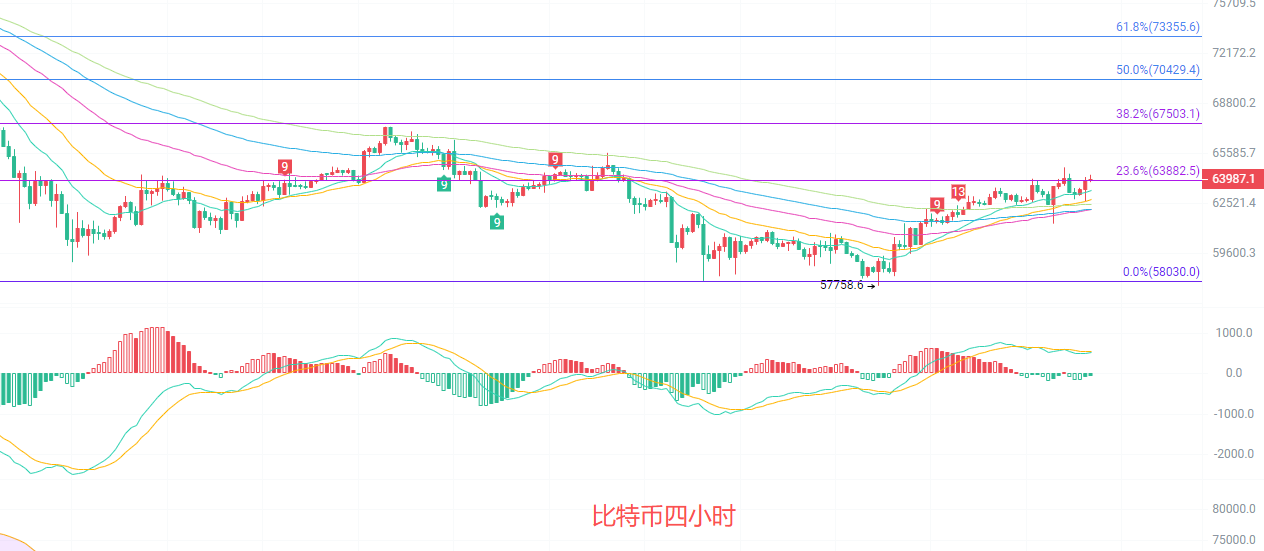
The four-hour K-line is steadily rising along the EMA15/30 moving averages, and the moving averages are aligned upward, indicating a sound short-term upward trend. The current price is above the Fibonacci 23.6% level at 63882, which serves as a strong short-term support level. As long as this level is not broken, the rebound trend will not be interrupted. The Bollinger Band is opening upwards, with the price operating near the upper line, indicating short-term dominance upward, but it also faces the risk of an overbought correction. Although the MACD red bars have shortened, the DIF is still above the DEA, indicating that upward momentum has not fully diminished. The support below is sequentially at the EMA60/90 moving averages' range of 62176-62180 and the previous low of 58030; the resistance above is the upper line of the Bollinger Band at 64156 and the Fibonacci 38.2% level at 67503, suggesting limited short-term rebound space.
Short-term reference:
If the price does not break below 63000 to 62500, go up, set a stop loss at 62000, and aim for 64500 to 65500.
If the price does not break above 64500 to 65000, go down, set a stop loss at 65500, and aim for 63500 to 62500.
Specific operations should be based on real-time market data. For more information and details, you can consult the author. There may be a delay in the publication of the article; suggestions are for reference only, and risks are to be borne by yourself.

Friendly reminder: The above content is solely created by the author of the public account. The advertisements at the end of the article and in the comments section are unrelated to the author. Please be cautious in distinguishing them. Thank you for reading.
免责声明:本文章仅代表作者个人观点,不代表本平台的立场和观点。本文章仅供信息分享,不构成对任何人的任何投资建议。用户与作者之间的任何争议,与本平台无关。如网页中刊载的文章或图片涉及侵权,请提供相关的权利证明和身份证明发送邮件到support@aicoin.com,本平台相关工作人员将会进行核查。