Cryptocurrency Scholar: On July 11, Ethereum (ETH) technical rebound comes to an end, is a new round of volatility approaching? Latest market analysis reference
Ethereum’s current price is 1797, and the daily chart's major downward structure remains unchanged. This rebound is merely a technical correction within a downtrend, a gentle trap for retail investors, not the start of a bull market. Many newcomers become blindly optimistic upon seeing a rebound, heavily investing without stop-loss, which will likely lead to being repeatedly harvested. The market is always more about oscillating and washing out than a one-sided rise or fall; don’t be swayed by short-term fluctuations. The core of trading has never been predicting market trends, but controlling risk, knowing where to enter, where to stop-loss, and never opposing the trend.
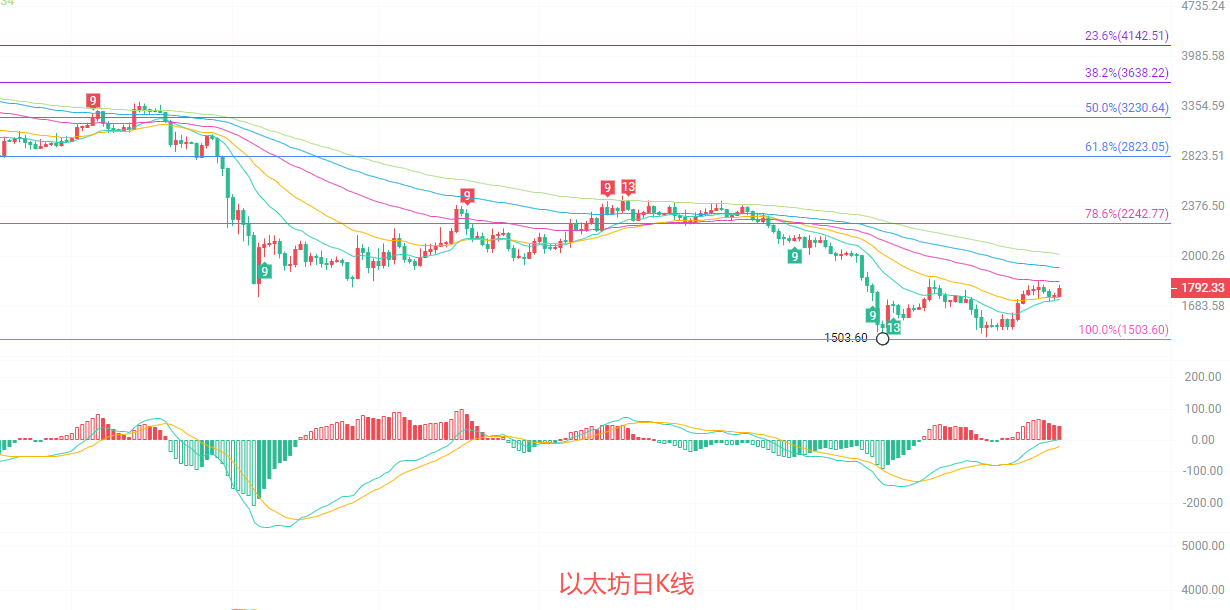
The daily K-line is currently in the rebound phase of a prior downtrend. From the EMA moving average system, the price is still running below the five-day moving average, with both short-term and long-term moving averages showing a typical downward arrangement, and the downward trend has not fundamentally reversed. In the MACD indicator, DIF crosses above DEA forming a golden cross, and the red bars continue to expand, indicating a release of short-term upward momentum. In terms of the Bollinger Bands, the price is above the middle band at 1683, closing in on the upper band resistance at 1854. The Fibonacci 78.6% retracement level at 2242 remains a strong resistance, and the 1503 low supports its validity, currently in the repair stage after the decline.
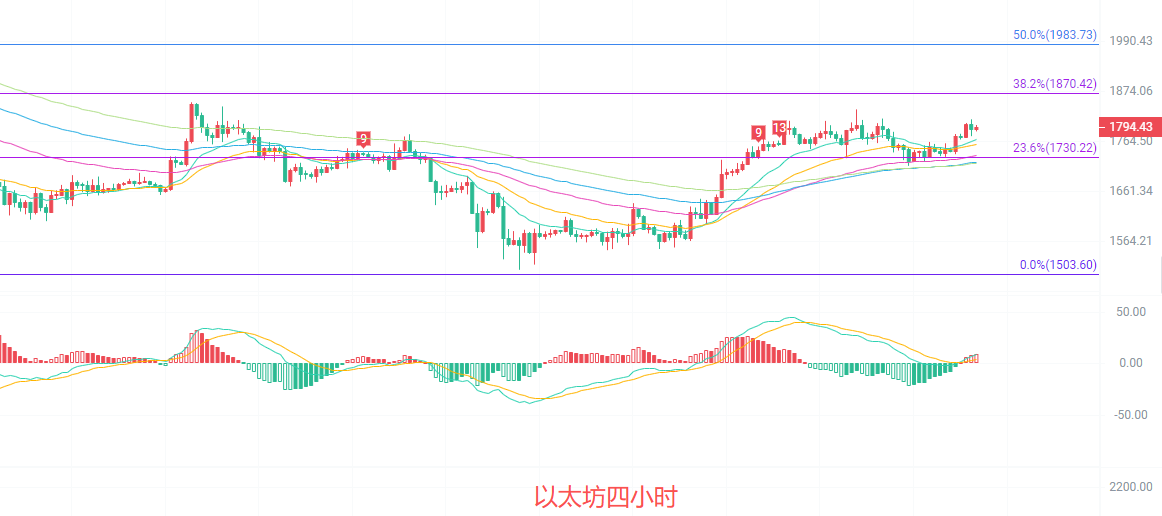
The four-hour K-line has stabilized above the short-term EMA15 and EMA30 moving averages, while also standing above the long-term EMA60, EMA90, and EMA120 moving averages, forming a clear short-term upward arrangement. The MACD indicator's DIF is above DEA, and the red bars continue to expand slightly, with upward momentum still ongoing, but nearing previous rebound highs. The middle band of the Bollinger Bands at 1760 provides effective support, with the price making a push toward the upper band resistance at 1807. The Fibonacci 23.6% retracement level at 1730 is a strong support in the recent period, while the 38.2% resistance level at 1870 will be a key test for this rebound; if it cannot break through, it will likely return to oscillation or decline.
Short-term reference:
If the price does not break below 1750 to 1700, an upward move is expected, stop-loss at 1650, target looking at 1820 to 1880.
If the price does not break above 1830 to 1860, a downward move is expected, stop-loss at 1900, target looking at 1780 to 1740.
Specific operations should be based on real-time market data; more information details can be consulted with the author. The article release may have some delay; suggestions are for reference only, risk is self-borne.

Warm reminder: The above content is exclusively created by the author for the public account. Advertisements at the end of the article and in the comment section are unrelated to the author. Please discern carefully; thank you for reading.
免责声明:本文章仅代表作者个人观点,不代表本平台的立场和观点。本文章仅供信息分享,不构成对任何人的任何投资建议。用户与作者之间的任何争议,与本平台无关。如网页中刊载的文章或图片涉及侵权,请提供相关的权利证明和身份证明发送邮件到support@aicoin.com,本平台相关工作人员将会进行核查。