7.11 Cryptocurrency Mr. Coin: Ethereum (ETH) Market Analysis Reference
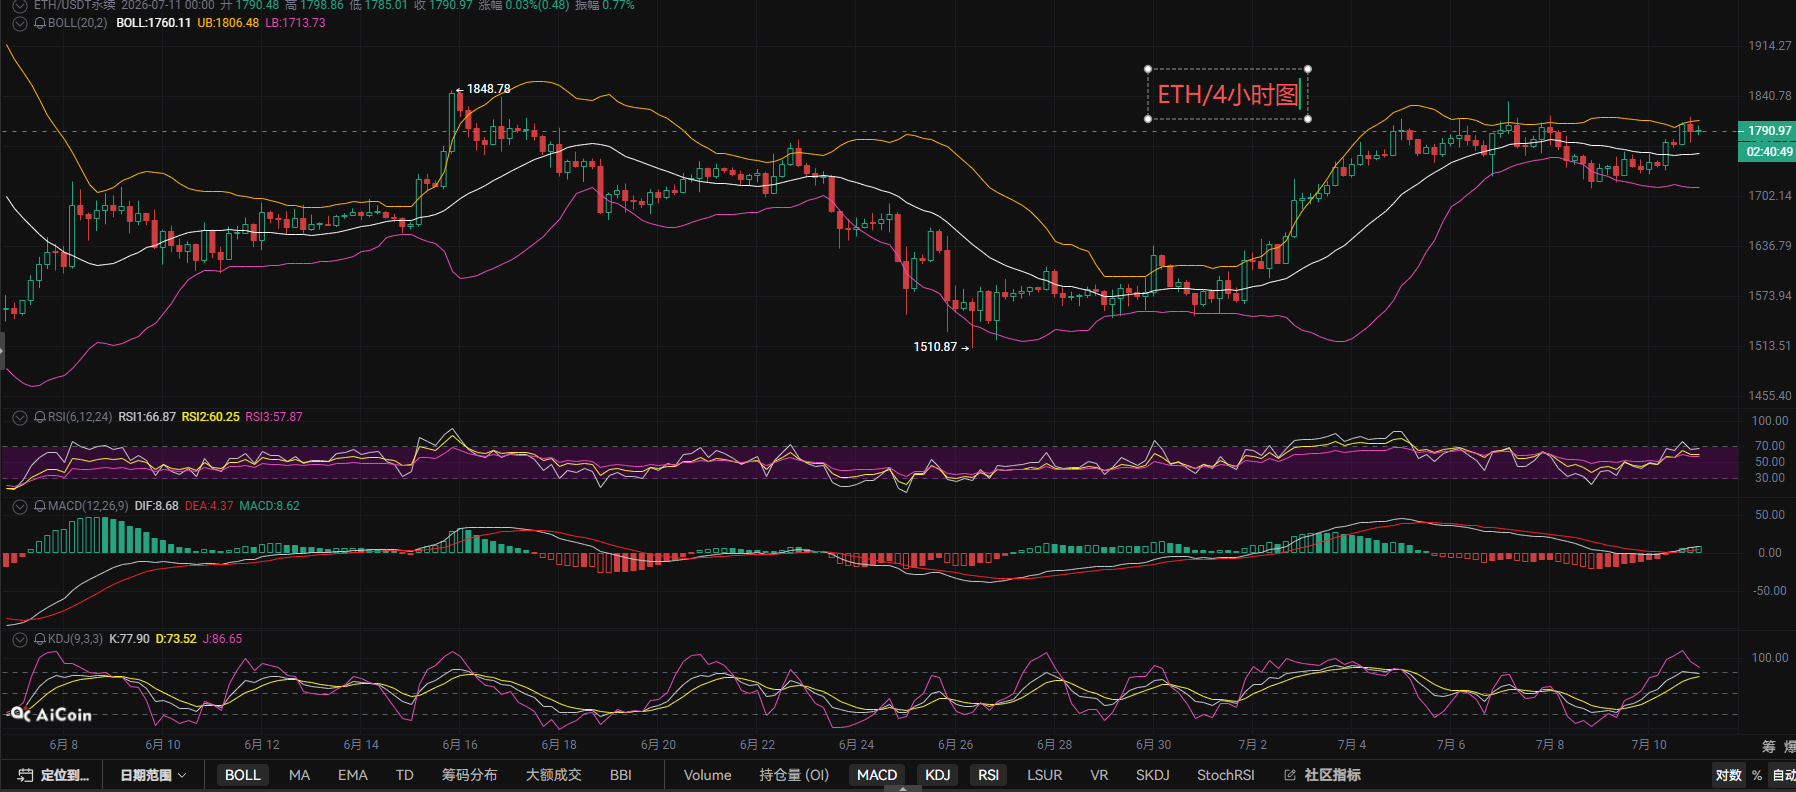
The current price of Ethereum is around 1790, as mentioned in yesterday's article. As long as the support at the low point of 1712 is not broken, there is a short-term opportunity for a recovery rebound. Today's market directly shows a rebound trend, with a 2.65% increase in the price within a single day on the 4-hour chart. After retracing to the middle Bollinger band, the price surged strongly, regaining stability above the middle band. The mid-term trend is biased towards bullish, forming a high-level oscillation pattern, with the previous high around 1834 being a short-term resistance level. On the indicator front, the MACD green bars have fully turned red, with bullish momentum being released again. The RSI has reached 68.55, close to the 70 overbought threshold, and there is a slight downward pressure above in the short term. The KDJ three lines are simultaneously rising, with the J value at 88.33 nearing the overbought zone, indicating a likely technical retracement after a surge.
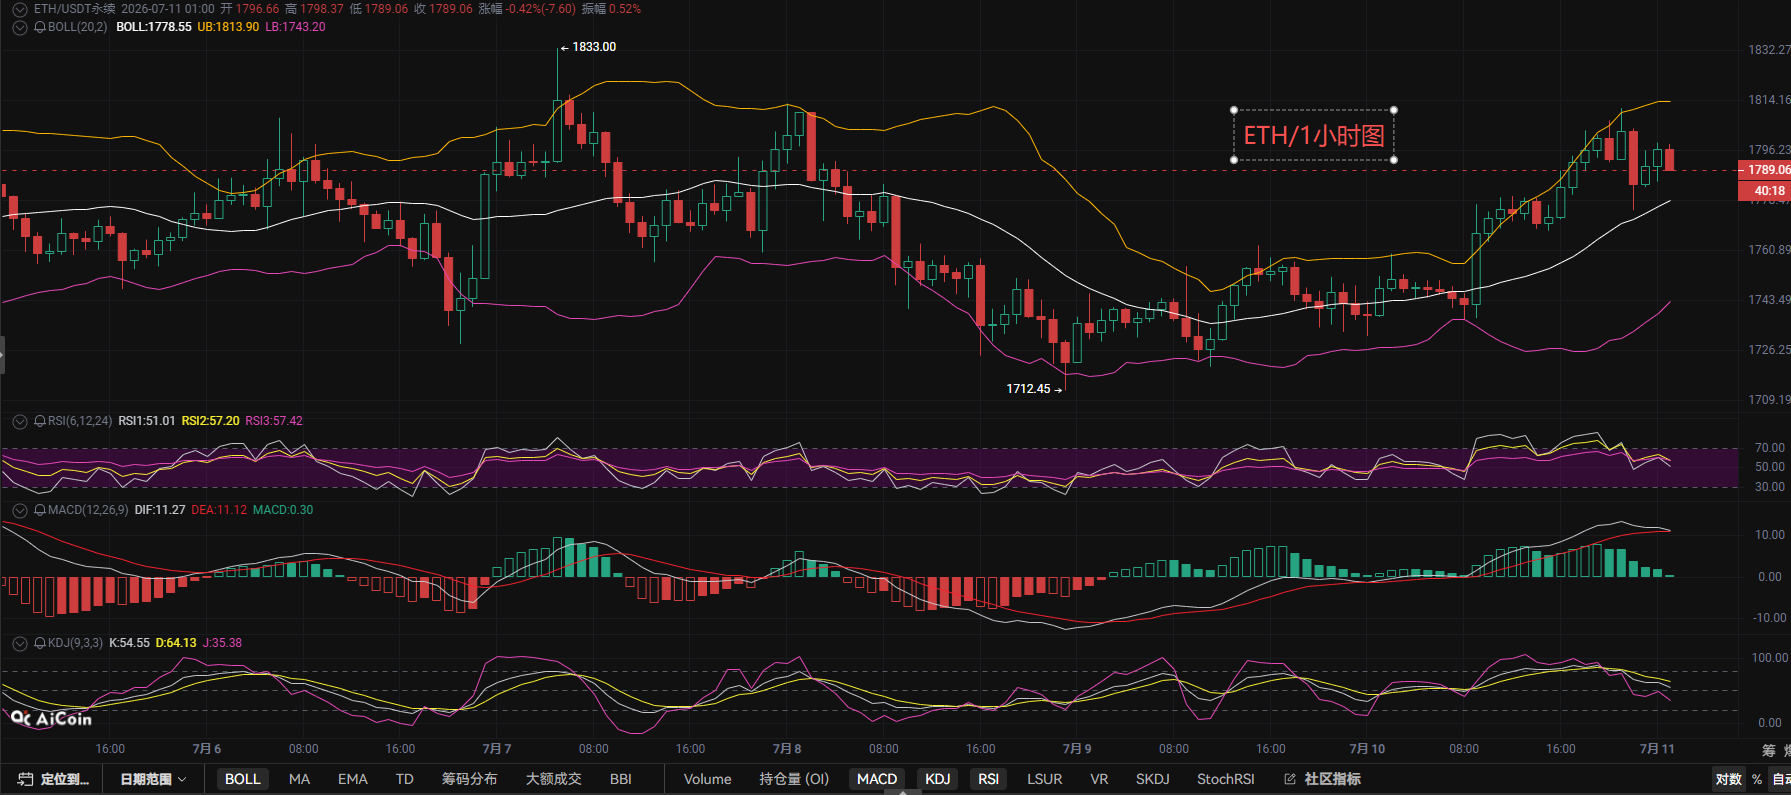
For short-term analysis on the hourly chart, the bullish trend is stronger, with the Bollinger Bands expanding upwards throughout. The price continues to rise based on the middle Bollinger band, reaching a daily high of 1812.82. The 1-hour MACD maintains small red bars, with a slight bullish bias. The RSI remains within the 57-61 range, not fully entering overbought territory, indicating a little upward potential remaining in the short term. The KDJ shows signs of a dead cross, suggesting that after a short-term surge, there will be a consolidation and pullback. The short-term key support below is at 1770 (middle Bollinger band), with strong support at the low point of 1736.
In terms of capital, there is currently a net outflow of 125 million, indicating a small outflow of funds. This shows that the current rebound is mainly a technical correction, with no large amounts of capital continuously entering to push the price up, so do not blindly chase the rise. Overall summary: Yesterday defended the support at 1712 and experienced a rebound. The mid-term oscillation remains bullish, but the 4-hour indicators are nearing overbought levels, along with a slight outflow of capital, making it unsuitable to chase high positions. It is safer to wait for a pullback to support before going long again.The above is only a technical sharing of the market and does not constitute any investment advice.Follow Mr. Coin for real-time market analysis.
7.11 Ethereum Short-term Reference:
If above 1825, go south, defend 1880, target below 1780,
If below 1730, go north, stop loss 50 points, target above 1760,
There is a delay in sending signals, and strategy suggestions are for reference only. The market changes rapidly; regardless of how high your judgment on market conditions is, be sure to manage your take profit and stop loss carefully to secure your gains.
For more daily real-time trading strategies, online technical learning, and solutions for exiting positions, you can follow the mentor's official account (Mr. Coin Talks about Coin) to obtain addition methods: The top ten each day can receive free set-up strategies.

免责声明:本文章仅代表作者个人观点,不代表本平台的立场和观点。本文章仅供信息分享,不构成对任何人的任何投资建议。用户与作者之间的任何争议,与本平台无关。如网页中刊载的文章或图片涉及侵权,请提供相关的权利证明和身份证明发送邮件到support@aicoin.com,本平台相关工作人员将会进行核查。