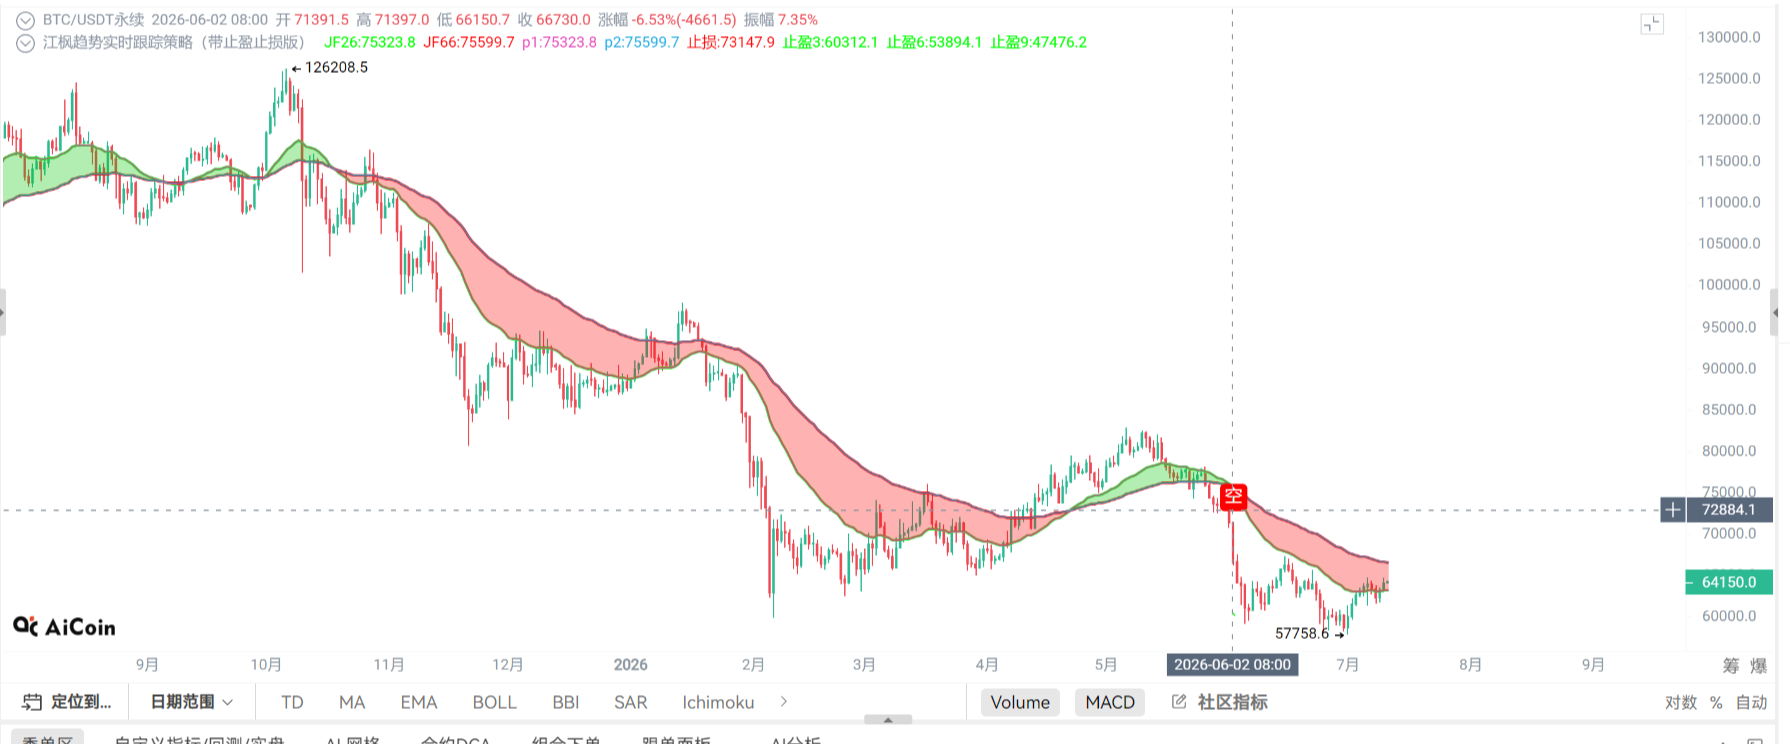
The market sentiment today is somewhat subtle, and I noticed two major news items worth highlighting. The first is that the probability of the Federal Reserve raising interest rates by 25 basis points in July has dropped to 27.3%, which directly implies that expectations for liquidity easing are warming up, providing clear positive support for risk assets like BTC. The second is that Galaxy Digital transferred 2,500 BTC to exchanges within an hour, worth $160 million. Such institutional-level sell-offs often depress prices in the short term, but considering the data on shorts being liquidated, the market's long-short competition is intensifying. In the last 24 hours, liquidations across the network totaled $236 million, heavily impacting short positions, indicating that short selling pressure is rapidly depleting, providing ammunition for a subsequent rebound. The Qinglan Crypto Classroom has always emphasized that news acts as a catalyst for the market, but the ultimate trend must be confirmed by technical analysis.
Current Price and Time
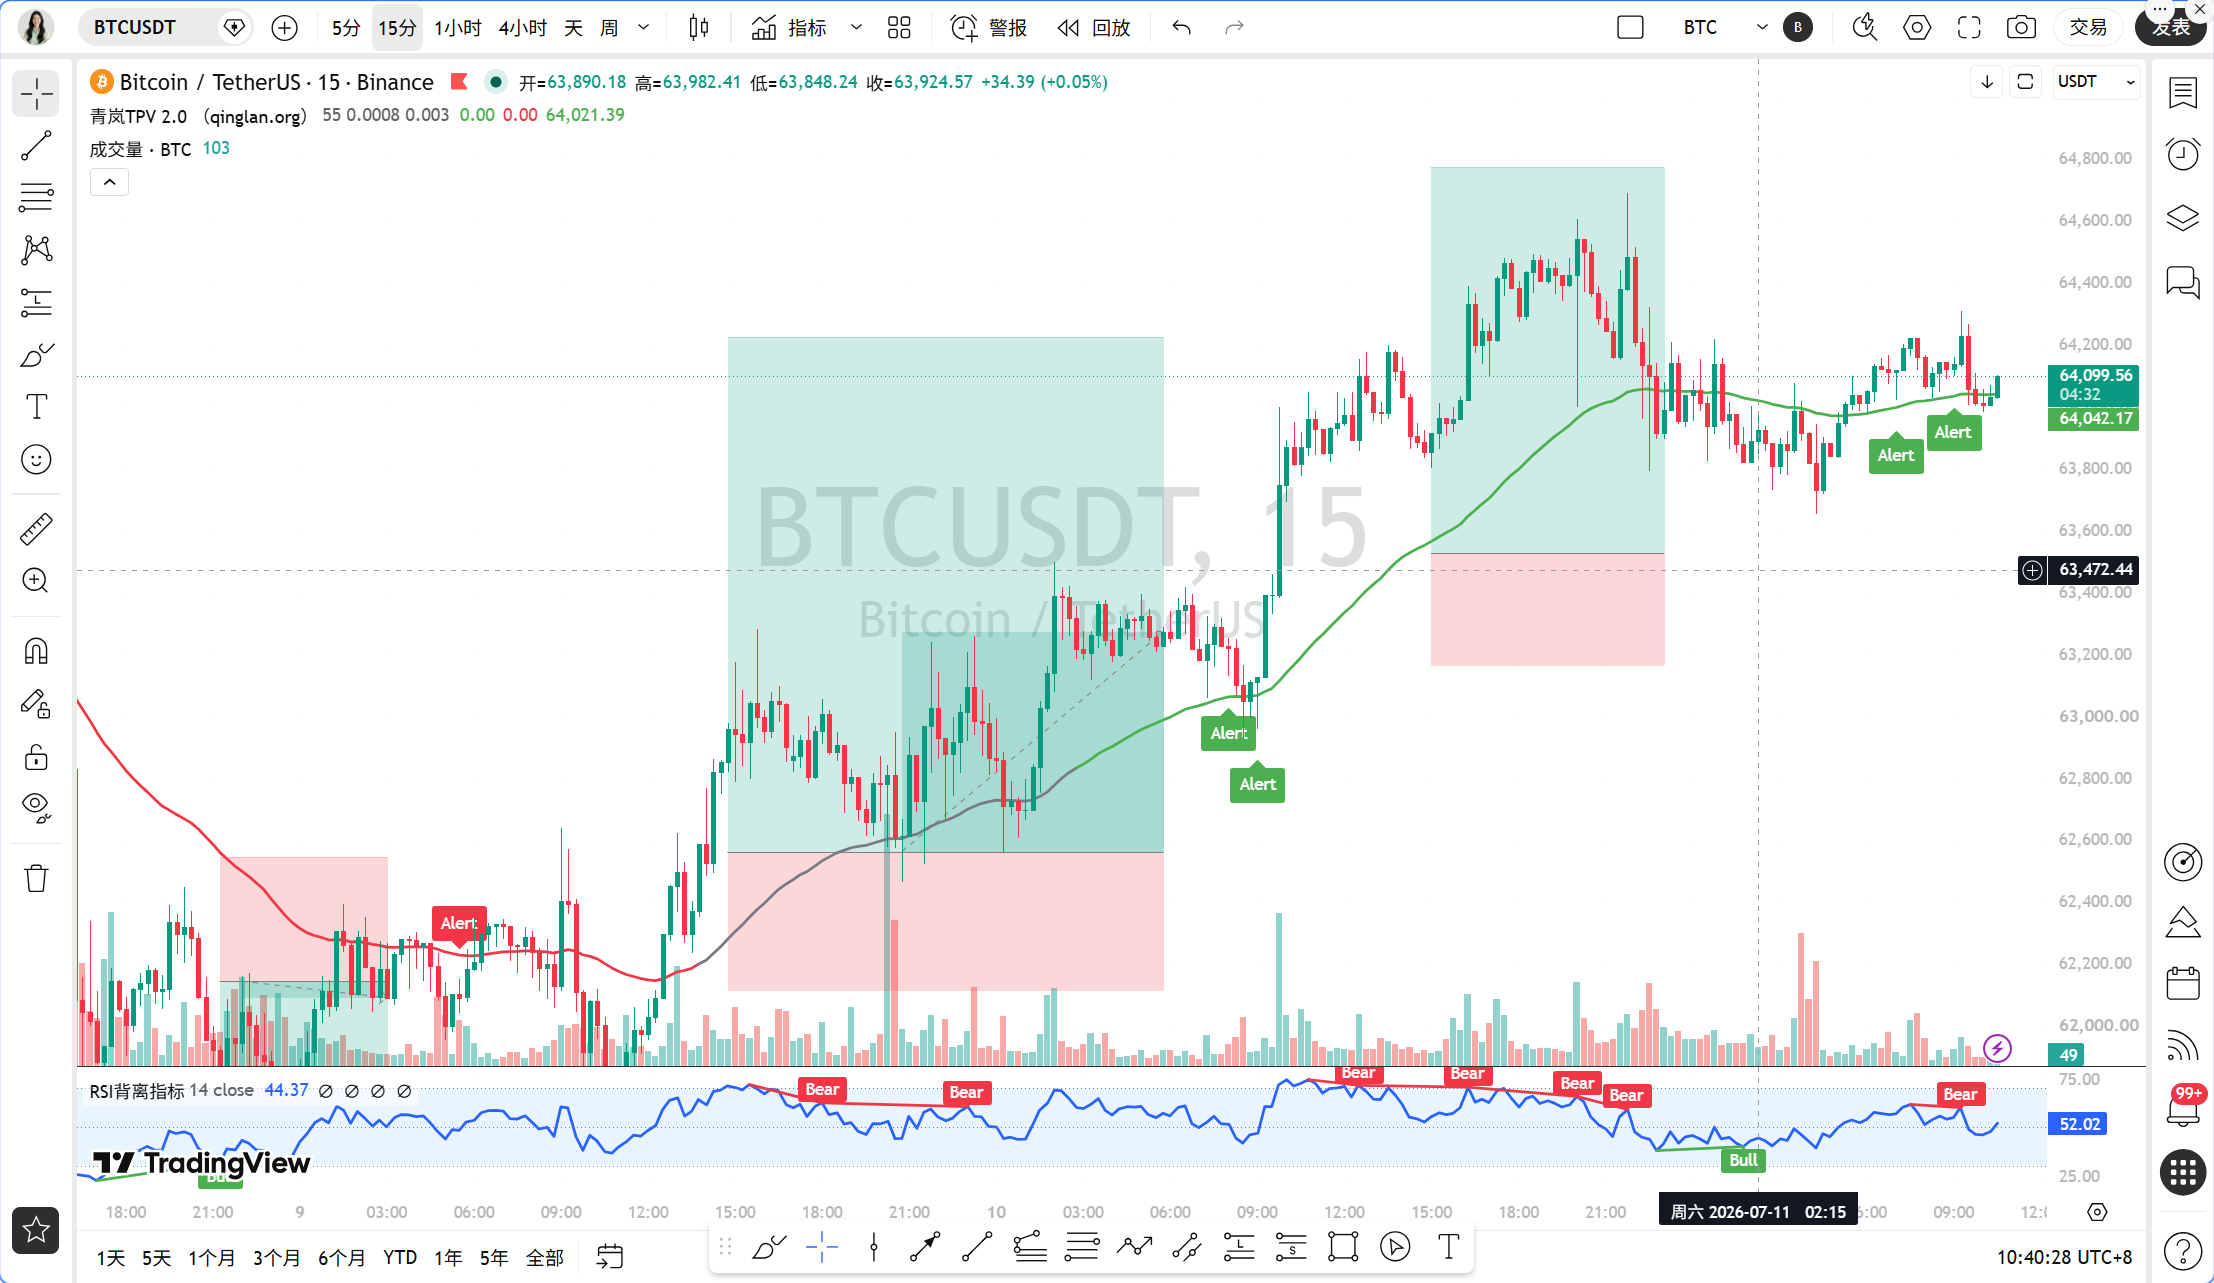
The current time is July 11 at 10:41, with BTC quoted at 64,108 USDT. The 24-hour increase is 0.39%, and the price is stabilizing after a narrow range of fluctuations. The Fear and Greed Index is only 26, which falls into the extremely fearful range, indicating that market sentiment is overly pessimistic, which often signals a potential reversal. BTC's market share is 56.31%, indicating that funds are still rotating among mainstream coins, and the effect of altcoins "sucking blood" is not significant.
Multi-Timeframe Overview
First, looking at the daily level, MA5 is at 63,430, MA10 is at 63,213, and MA30 is at 62,759, with the moving averages showing a bullish arrangement, and the price firmly above all moving averages. The MACD's DIF is -310.34, DEA is -917.83, and the histogram is 607.48. Although DIF is still below the zero line, the histogram has been positive and continues to expand, indicating that the downward momentum at the daily level is exhausting, and bulls are gaining strength. The RSI is 67.19, in the neutral to slightly strong area, without overbought risks.
Switching to the 4-hour level, MA5 is at 64,130, MA10 is at 63,790, and MA30 is at 63,252, with moving averages also showing a bullish arrangement. The MACD's DIF is 383.96, DEA is 281.46, and the histogram is 102.50, with both DIF and DEA above the zero line, and the histogram remaining positive, indicating that the bullish trend at the 4-hour level is very healthy. The RSI is 72.61, close to the overbought area, but not extreme, indicating a short-term need for a pullback, but not changing the trend.
At the 1-hour level, MA5 is at 64,103, MA10 is at 63,992, and MA30 is at 63,957, with the price oscillating near the moving averages. The MACD's DIF is 136.74, DEA is 178.44, and the histogram is -41.70, with DIF below DEA, and the histogram continuously negative, indicating a short-term adjustment at the 1-hour level. The RSI is 45.69, in the neutral to weaker zone, showing insufficient short-term momentum.
At the 15-minute level, MA5 is at 64,044, MA10 is at 64,096, and MA30 is at 64,040, with the price tangled between moving averages. The MACD's DIF is 12.77, DEA is 24.22, and the histogram is -11.44, with DIF below DEA, and the histogram continuously negative. The RSI is 49.23, representing a typical oscillating pattern.
TPV Signal Verification
Now let's use the Qinglan TPV system to verify trend positioning. The current price is 64,108, and the 1-hour EMA55 is 63,619.66, with the price clearly above EMA55. According to system rules, this falls within a bullish trend area. Support data shows that in the last 8 1-hour candles, the closing price was greater than EMA55 8 times, with zero crosses, and the current price's absolute distance from EMA55 is 0.77%, not meeting the oscillating threshold, indicating the market is in a unilateral bullish trend.
For long entry conditions, the first condition has been met, with the price closing above EMA55 for multiple consecutive 1-hour candles. The second condition is a support stabilization; the 1-hour chart shows the price receiving support multiple times around 63,600, forming a clear bottom structure, and volume is increasing at the support level, indicating that funds are buying. The third condition is the exhaustion of downward momentum; although the 1-hour MACD histogram is negative, the last two histograms are -45.12 and -41.70, showing a shortening trend, and the RSI is recovering from around 40 to 45.69, indicating that selling pressure is weakening. With all three conditions met, the TPV system provides a clear long signal.
For short entry conditions, the price is above EMA55, so the first condition is not met, and therefore shorts are not considered.
On-chain Funding Aspects
The overall on-chain data is bullish. The Fear and Greed Index is 26, placing it in the extremely fearful range, which historically often corresponds to a phase bottom. The scale of short liquidations far exceeds long positions, indicating that shorts are being heavily liquidated, providing fuel for a price rebound. However, the pressure from institutional sell-offs must be monitored; Galaxy Digital's transfer of 2,500 BTC may trigger short-term selling, but considering the scale of short liquidations, this sell-off may be quickly absorbed. The news of Tether suspending its buyback is neutral, with limited impact on the market.
Key Defense and Offense Positions
The first resistance level above is at 64,500, which is an area of pressure formed by previous highs. If this is broken, the next target is at 65,200, which is the upper limit of the 4-hour channel. The first support level below is at 63,600, which aligns with the 1-hour EMA55, also the dividing line for the TPV system between bullish and bearish. If this is breached, the next support is at 63,200, corresponding to the 4-hour MA10. The defensive level is set at 63,000, which is the dense support area of the daily MA5 and MA10.
Trading Thoughts
The direction is clearly bullish. There are two entry scenarios. Scenario one is an aggressive entry; near the current price of 64,108, a small position can be taken long due to the TPV system providing a long signal, and short liquidation data supporting the rebound. Scenario two is a conservative entry, waiting for the price to retrace near the 1-hour EMA55, that is, the 63,600-63,700 range, and confirming support before entering. The stop-loss is uniformly set at 63,000; breaching this level would signify the destruction of the bullish trend, necessitating exit. The target levels are divided into two tiers: the first target is 64,500 and the second target is 65,200. If the price rapidly exceeds 64,500 and stabilizes, positions can be increased targeting 65,200.
Risk Warning
Institutional sell-offs and geopolitical risks are the biggest uncertainties in the short term; positions must be strictly controlled, with individual risks not exceeding 2% of total capital.
Follow the Qinglan Crypto Classroom to seize more trading opportunities! Welcome to visit the official website www.qinglan.org
📊 Qinglan TPV Trading Strategy Backtesting Reference
🕒 Last Backtesting Time 07-11 07:00:01
Total Analysis: 2860 Backtests: 2226 Accuracy: 75.5% (1681/2226)
免责声明:本文章仅代表作者个人观点,不代表本平台的立场和观点。本文章仅供信息分享,不构成对任何人的任何投资建议。用户与作者之间的任何争议,与本平台无关。如网页中刊载的文章或图片涉及侵权,请提供相关的权利证明和身份证明发送邮件到support@aicoin.com,本平台相关工作人员将会进行核查。