Crypto Circle Academic: On July 19, Bitcoin (BTC) is fluctuating back and forth; who is secretly accumulating? Who is fleeing madly? Latest market analysis and trading advice explained
Currently, Bitcoin is at 64300, and it has reached that familiar stage of being stuck with no upward or downward movement. Every time there is volatility, some shout that the bull market has started and a major top has appeared. What is the result? It's just mutual slapping of faces between the north and south. Don't listen to what others say about investing all in; if they lose, you don't need to cover for them, and if you get liquidated, no one will carry the burden for you. Manage your own hands well and don’t toss and turn during the fluctuations; the fees and losses outweigh the gains, which is really not worthwhile. Last year, when it was at 120000, many crypto friends asked me if they could buy the dip. I said at the time to position after a halving, and I don't know how many can hold on after the halving to 60000 this wave.
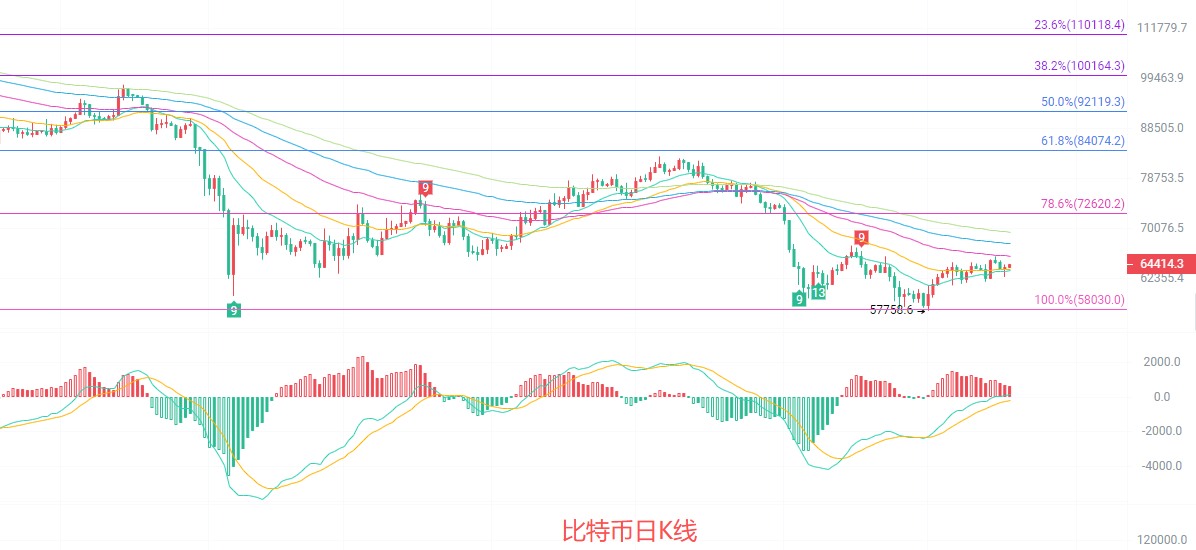
The daily K-line is still fluctuating between EMA30 and EMA60, belonging to a recovery market after a decline. The MACD red bars continue, and the DIF and DEA golden cross is moving upwards, northern momentum is warming up slightly, but it has not yet broken through the middle track resistance of the Bollinger Bands at 62909. The key resistance above is at the 78.6% Fibonacci level of 72620, while the support below is at the 100% retracement level of 58030; overall, it has not escaped the bear trend of fluctuating downward.
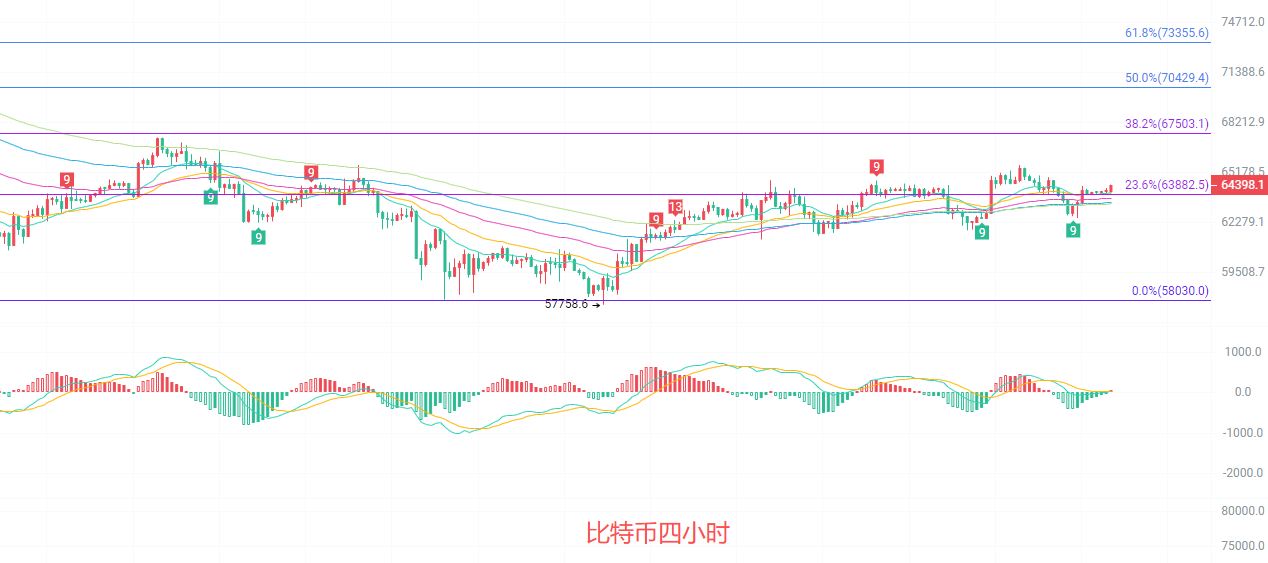
The four-hour K-line is running closely to EMA15, EMA30 and EMA60 have formed a golden cross, and the short-term moving averages are arranged upwards. The MACD red bars are shrinking, and the DIF shows signs of turning down, indicating that northern momentum is diminishing. The Bollinger Bands are narrowing, and the price is running between the middle track and upper track. The support at the 23.6% Fibonacci level of 63882 has been broken, and the next resistance level is at 38.2% of 67503. In the short-term upward fluctuation rhythm, we need to be wary of the risk of a pullback.
Short-term reference:
If it does not break below 63100 to 62700, go north, stop loss at 62200, target looking at 64500 to 65500
If it does not break above 65500 to 66000, go south, stop loss at 66500, target looking at 64500 to 64000
Specific operations depend mainly on real-time market data. For more information, you can consult the author. There may be delays in article publication; suggestions are for reference only, and risks are borne by oneself.

Warm reminder: The above content is solely created by the author's official account. The advertising at the end of the article and in the comments section is unrelated to the author; please distinguish carefully. Thank you for reading.
免责声明:本文章仅代表作者个人观点,不代表本平台的立场和观点。本文章仅供信息分享,不构成对任何人的任何投资建议。用户与作者之间的任何争议,与本平台无关。如网页中刊载的文章或图片涉及侵权,请提供相关的权利证明和身份证明发送邮件到support@aicoin.com,本平台相关工作人员将会进行核查。