Cryptocurrency Expert: Is the sideways fluctuation of Ethereum (ETH) on July 19 just a setup trap for a one-sided market? Latest market analysis reference
The current price of Ethereum is 1848. There is no need to be anxious about Ethereum's current sideways fluctuations; the position at 1844 is merely the market gathering strength for a shift. All sideways movements are to lay the groundwork for the upcoming one-sided market. The current back-and-forth is just cleaning out weak hands. Trading is inherently a slow-paced practice; there's no need to try to speculate on every single candlestick. If you can't understand it, just observe. Only act when you're confident. Steady profits are more important than hurried losses. Keep a calm mindset and patiently await directional clarity; the market will eventually provide answers for those who are patient.
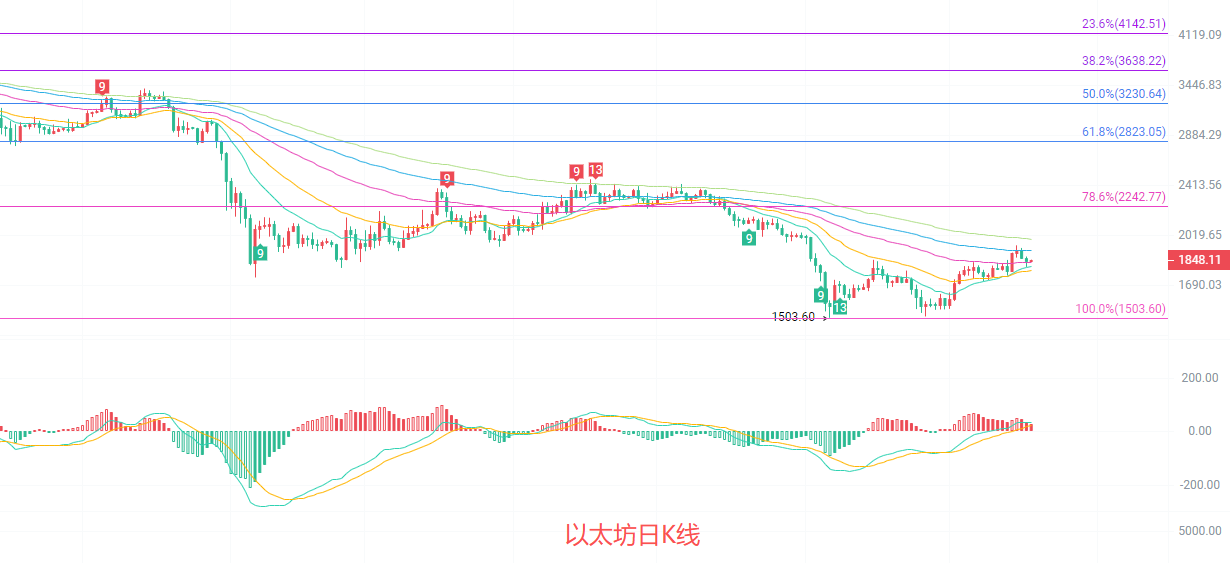
The daily candlestick chart is currently in the oscillation repair phase between the Fibonacci 78.6% retracement level of the previous downtrend at 2242 and the 100% low at 1503. In the short term, the EMA moving averages are arranged upwards, with the EMA15 and EMA30 forming support below. The Bollinger Band middle line provides strong support near 1769, while the upper line creates short-term pressure at 1946. The MACD indicator shows a continuous shrinkage of red bars; although the DIF remains above the DEA, the upward momentum is clearly weakening, suggesting that the rebound may be nearing its end. The key resistance levels are at the round number of 1900 and near 1946. If it can't break through with volume, it is highly likely to return to fluctuation.
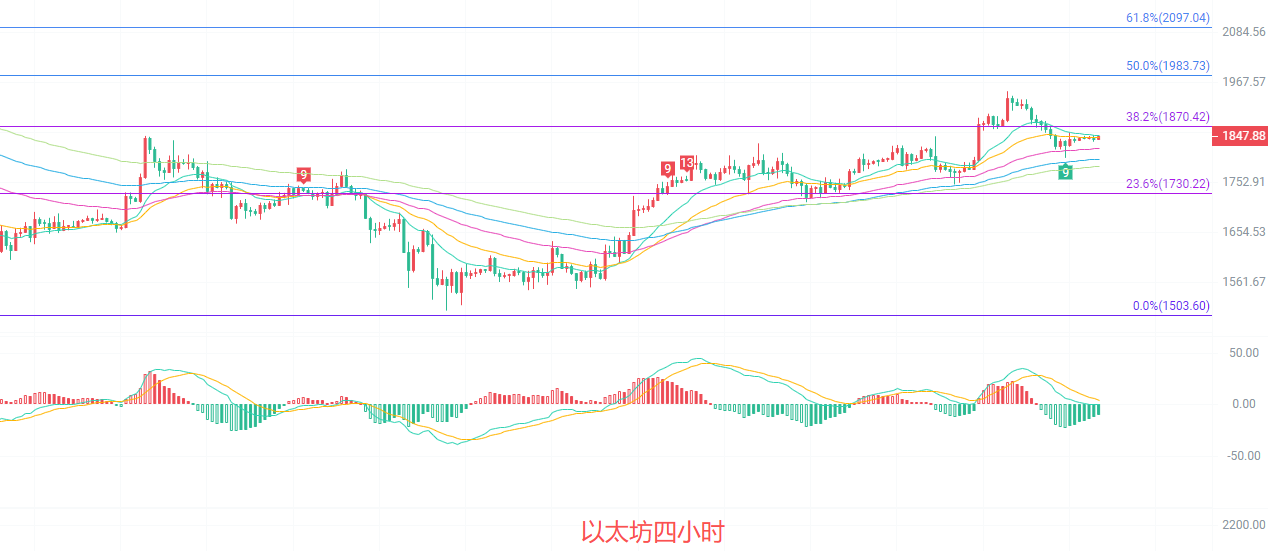
The four-hour candlestick chart is oscillating within the Fibonacci 23.6% and 38.2% range. The EMA moving averages are arranged upwards, with the 15/30/60 day moving averages forming a dense support zone in the 1820-1830 range. The middle line of the Bollinger Band forms short-term pressure near 1867, while the upper line at 1934 and the lower line at 1800 set the current oscillation range. The MACD indicator shows a reduction in red bars; the DIF has turned downward, indicating a potential crossover with the DEA that could form a death cross. The short-term upward momentum is clearly waning, and the price has faced repeated resistance around 1870, failing to make an effective breakthrough, leading to a gradual increase in bearish signals.
Short-term reference:
If the lower boundary of 1820 to 1790 holds, it may go upwards. Stop loss at 1760, target at 1880 to 1920.
If the upper boundary of 1920 to 1960 holds, it may go downwards. Stop loss at 1990, target at 1880 to 1830.
Specific operations should be based on real-time market data. For more detailed information, you can consult the author. There may be delays in article publication; the advice is for reference only, and risks are borne by the reader.

Reminder: The above content is solely created by the author of the public account. Any ads at the end of the article and in the comment section are not related to the author; please discern carefully. Thank you for reading.
免责声明:本文章仅代表作者个人观点,不代表本平台的立场和观点。本文章仅供信息分享,不构成对任何人的任何投资建议。用户与作者之间的任何争议,与本平台无关。如网页中刊载的文章或图片涉及侵权,请提供相关的权利证明和身份证明发送邮件到support@aicoin.com,本平台相关工作人员将会进行核查。