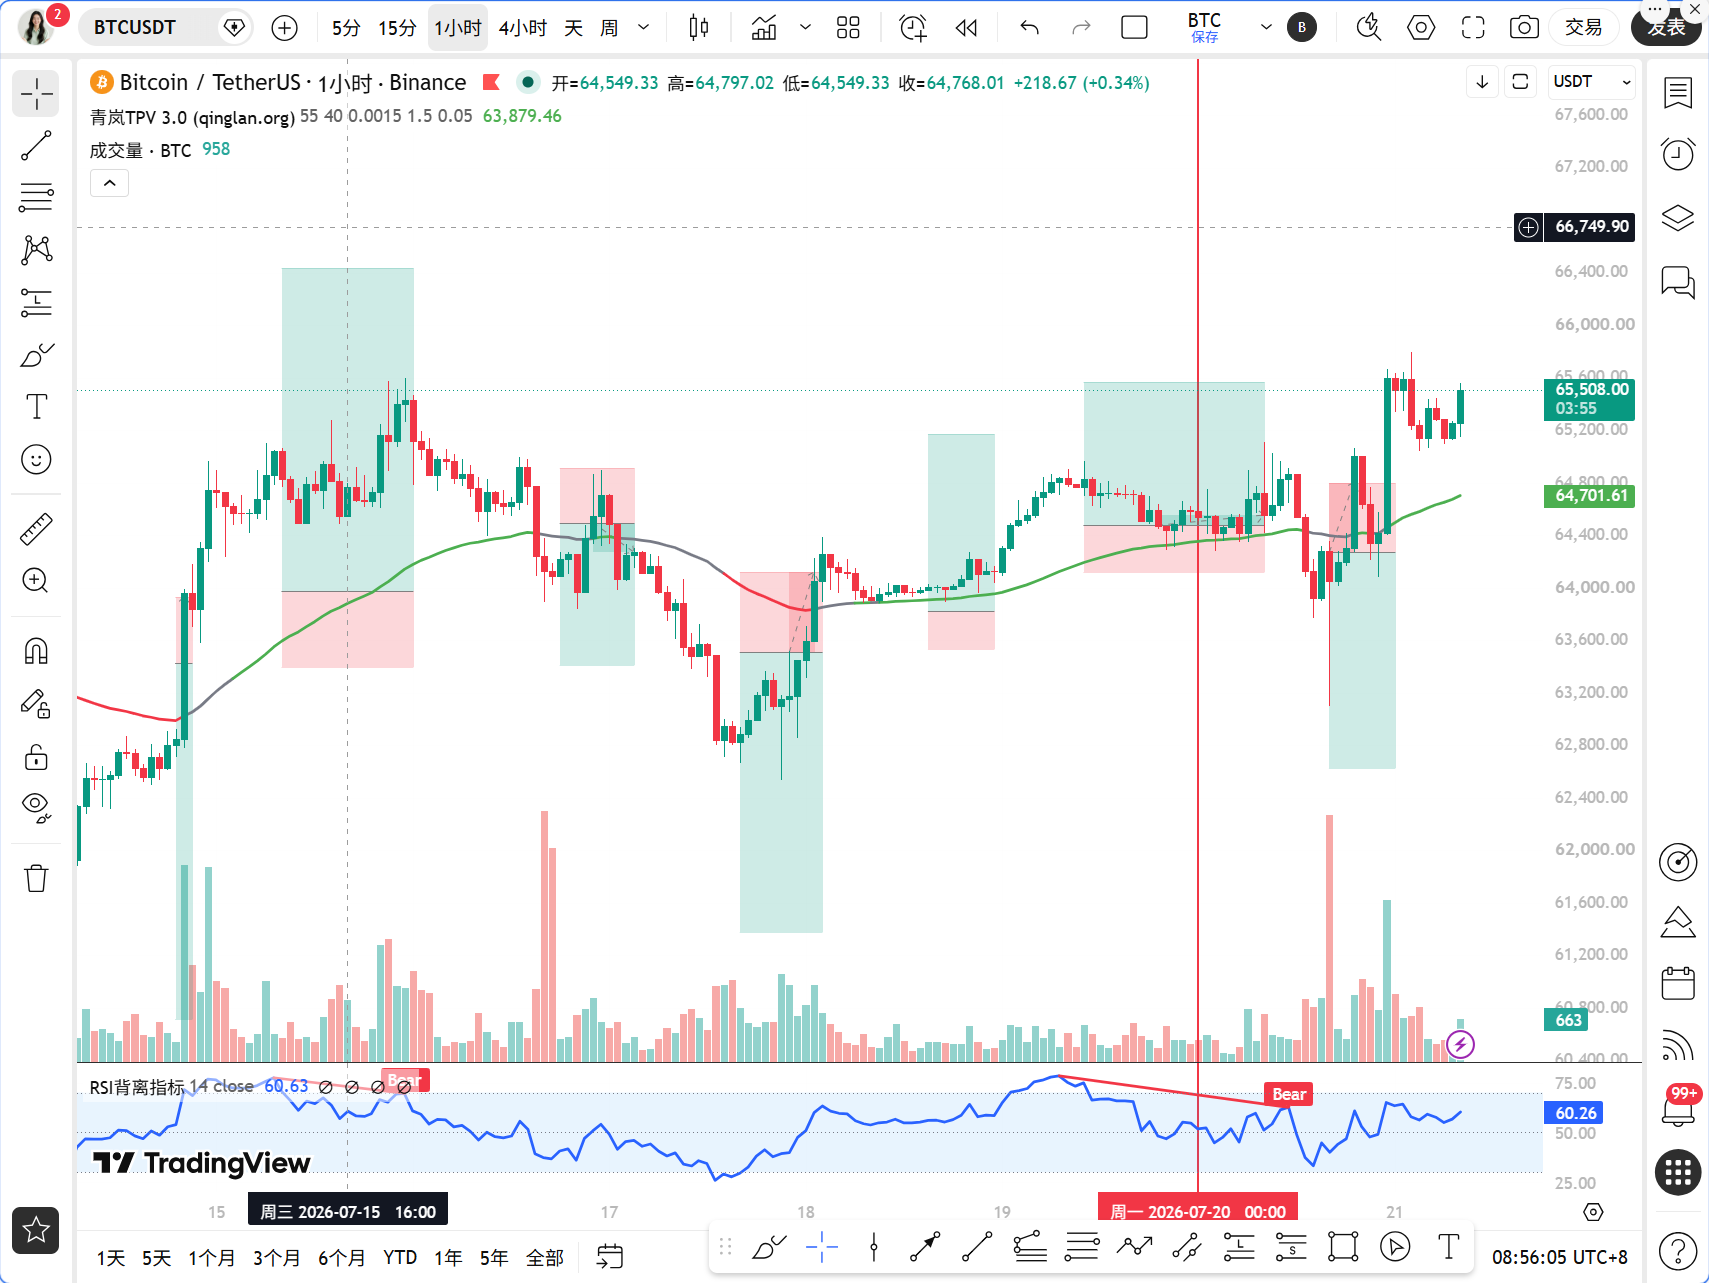
Dear friends, I am Qinglan. This morning, the market was influenced by two pieces of news. One is that the United States has imposed a 50% tariff on Canada, effective from August, escalating trade tensions that may trigger global risk aversion; the second is that South Korean stocks plummeted nearly 4.5%, spreading panic in Asian markets. These two pieces of negative news combined bring pressure to the cryptocurrency market in the short term. On the other hand, CZ once again emphasized Bitcoin's anti-inflation properties, and mining company Hut 8 received an $9.8 billion AI order, indicating that long-term confidence remains. This mixed scenario of bullish and bearish forces is precisely the time to test our trading system. Today, we will use the Qinglan TPV system to analyze the market and see how to respond to BTC at the position of $65,574.
Current Price and Time
The current time is July 21st, 09:11, and BTC is reported at 65,574 USDT. The 24-hour increase is 1.11%, but the Fear and Greed Index is only 25, indicating extreme fear in the market. This suggests that market sentiment is cool, but the price is slowly climbing, a typical "rising in fear" pattern. We need to let data speak and cannot rely on feelings.
Multi-Cycle Status Overview
First, let's look at the daily chart. The daily MA5 is at 64,863, MA10 at 64,406, and MA30 at 62,738, with the moving average system in a bullish arrangement. The MACD bar is at 338.58, DIF is above DEA, and RSI is at 60.36, which belongs to a moderately bullish area. The daily trend is upward, but not strong.
At the 4-hour level, MA5 is at 65,314, MA10 at 64,949, and MA30 at 64,384, with the price above all moving averages. The MACD bar is at 88.67, and DIF and DEA are opened upward, RSI at 62.45. Bullish momentum at 4 hours continues, but the MACD bar does not show significant expansion, indicating a slow rising pace.
At the 1-hour level, MA5 is at 65,365, MA10 at 65,367, and MA30 at 64,810, with the price above the averages. EMA55 is at 64,757, the current price of 65,574 is 1.26% higher than EMA55. The MACD bar is at 49.91, with DIF and DEA upward, RSI at 58.38. The 1-hour bullish trend is clear, but RSI is in the 50-60 range, which is not considered overbought.
At the 15-minute level, MA5 is at 65,435, MA10 at 65,319, and MA30 at 65,307, with the price above the averages. The MACD bar is at 29.59, with DIF and DEA upward, RSI at 62.55. The short cycle's bullish momentum is still present, but the MACD bar shows signs of shortening, which may indicate a consolidation phase.
Summary: The daily, 4-hour, and 1-hour charts all show a bullish trend, while the 15-minute chart is bullish but with weakening momentum. Multi-cycle resonance is upward, but the short cycle has a demand for adjustment.
TPV Signal Verification
Now let's verify using the core rules of the Qinglan TPV system.
First, let's look at trend positioning. The current price is 65,574, and the 1-hour EMA55 is 64,757. The price is above EMA55, so it is in a bullish trend area. The oscillation auxiliary data also shows that in the past 8 1-hour candlesticks, the closing price was greater than EMA55 a total of 8 out of 8 times, with 0 crossovers, and the price's amplitude from EMA55 is 1.26%, which does not meet the oscillation threshold. Therefore, it is currently a unilateral bullish trend, not a consolidation.
Long Position Condition Check. First, is the price stable above the 1-hour EMA55? Have two consecutive 1-hour candlesticks closed above EMA55? The last two 1-hour candlestick closes are 65,500 and 65,574, both higher than 64,757, so the condition is met. Second, is support stabilizing? Is there a long lower shadow on the most recent 1-hour candlestick? The 07:00 candlestick's lowest point was 65,300, then rebounded to 65,500, with a lower shadow length of about 200 points, which is valid support. Third, is the downward momentum exhausted? The MACD bar between 06:00 and 07:00 shortened, then expanded again, but overall remained above the zero axis, and RSI rose from 55 to 58 without oversold signals. So, the conditions for going long are partially met, but the momentum exhaustion signal is not perfect.
Short Position Condition Check. First, is the price under pressure below the 1-hour EMA55? The current price is above EMA55, so this condition is not met. Therefore, the short position condition does not hold.
Conclusion: The TPV system gives a bullish signal, but the momentum signal is weak, making it not the best entry point. Waiting for clearer support stabilization or momentum exhaustion signals is needed.
On-chain/Fundamentals
On-chain data shows a Fear and Greed Index of 25, indicating extreme fear. This often implies a market bottom area, but there may still be volatility in the short term. The BTC market dominance is 56.59%, indicating that funds are still in BTC, with no large-scale flow into altcoins. In news, large ETH staking reduces circulating supply, and Arthur Hayes bought ETH, which provides support for ETH, but BTC is more affected by the U.S. stock market and trade tensions. The U.S. stock market has declined for three consecutive days, while AI stocks’ sell-off has paused, but overall risk appetite is decreasing. Regulatory tightening in South Korea and the SEC suing a mining scam also suppress negative speculation.
Key Attack and Defense Levels
For bulls, the first support level is the 1-hour EMA55 at 64,757. If the price retraces here and does not break, it is strong support. The second support level is the 4-hour MA30 at 64,384. If it breaks, the bullish trend may weaken. The third support level is the daily MA30 at 62,738, which is a key mid-term level.
For bears, the first resistance level is near the previous high of 66,000, which is a psychological point. The second resistance level is the previous high of 66,500 from 4 hours ago; if it breaks, it may accelerate the rise. The third resistance level is the daily previous high of 67,000.
Trading Thoughts
Direction: Bullish trend, but short-term momentum is insufficient; wait for a pullback to go long, do not chase high prices.
Entry Conditions: If the price retraces to around the 1-hour EMA55, namely the 64,757-64,800 range, and shows a long lower shadow or bottoming pattern, while the MACD bar shortens or RSI rises from below 30, a light long position can be taken. If the price directly breaks through 66,000 and stabilizes, a long position can also be chased, but confirmation through volume is needed.
Stop-Loss Level: If going long, set the stop-loss below 64,384, that is, below the 4-hour MA30. If chasing a long position, set the stop-loss below 65,500.
Target Levels: First target 66,000, second target 66,500, third target 67,000.
Risk Reminder
Trade tensions and declines in the U.S. stock market may trigger short-term panic selling; be mindful of position control and avoid heavy positions.
Follow the Qinglan Cryptocurrency Classroom to grasp more trading opportunities! Welcome to visit the official website www.qinglan.org
📊 Qinglan TPV Trading Strategy Backtest Reference
🕒 Last Backtest Time 07-21 07:00:39
Total Analysis: 3095 Backtests: 2345 Accuracy Rate: 76.5% (1795/2345)
免责声明:本文章仅代表作者个人观点,不代表本平台的立场和观点。本文章仅供信息分享,不构成对任何人的任何投资建议。用户与作者之间的任何争议,与本平台无关。如网页中刊载的文章或图片涉及侵权,请提供相关的权利证明和身份证明发送邮件到support@aicoin.com,本平台相关工作人员将会进行核查。