Recently, the trend of the cryptocurrency market has become increasingly independent of traditional risk assets, even showing significant differences from the previously common correlation patterns.
Previously, the market usually found it easier to amplify fluctuations during U.S. stock trading hours, but recently there have frequently been occurrences of a proactive rally or pullback in the Asian session, while the U.S. stock session has instead entered a phase of oscillation and consolidation. Yesterday’s market was such an example, maintaining a nearly one-sided rise during the day until about half an hour after the U.S. stock market opened, when the market began to pull back, ultimately ending the daily line with a small bullish candle with an upper shadow.
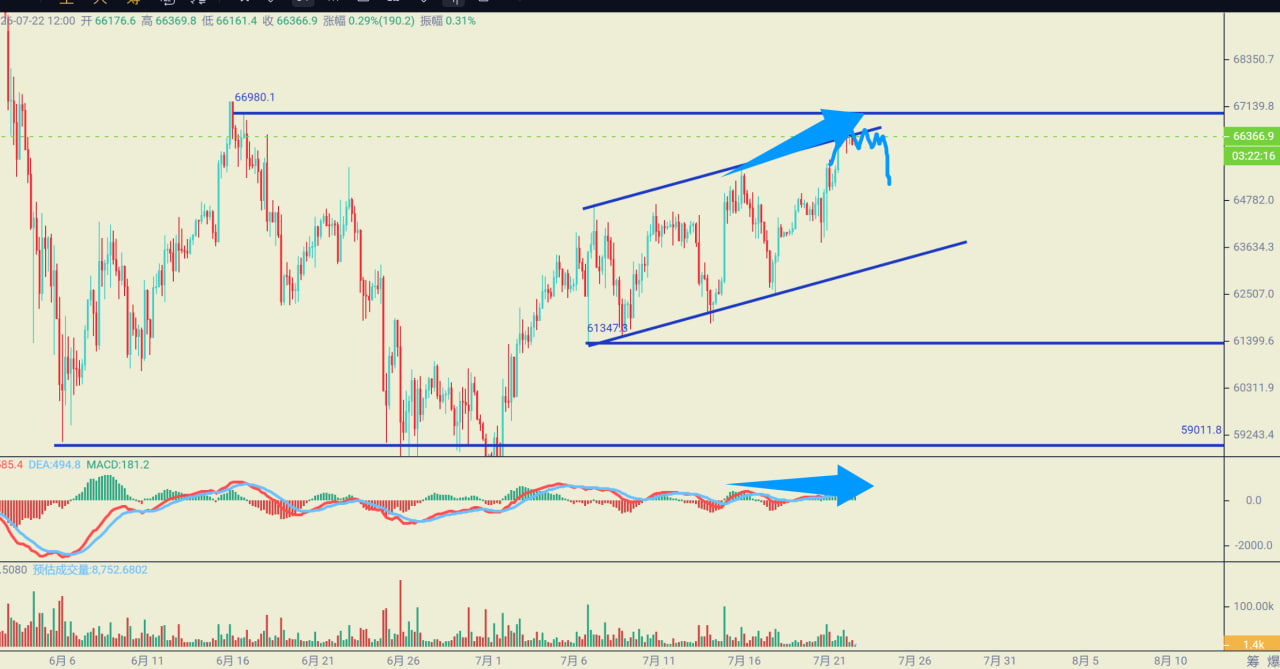
From a broader perspective, this round of rebound has lasted nearly four weeks. Although the pace of increase has significantly slowed this week, with each rise feeling relatively laborious, the bulls have not easily given up, instead continuing to push prices higher bit by bit through **“time for space, inching up the ladder”**.
This trend indicates that the bulls are still struggling to maintain the rebound structure, but it also means that the market is entering a more sensitive phase. As prices continue to rise, profit-taking accumulates and the willingness to chase higher prices decreases; future trends will need more incremental capital support to continue opening up upward space.
If new funds do not step in, the probability of high-level fluctuations or even technical pullbacks will also increase.
However, from the current monthly chart structure, as long as there is no sudden bearish impact, the July monthly K-line is very likely to close as a bullish candle, and the medium to long-term rebound trend has not changed.
₿ Bitcoin (BTC)
View: Sell high and buy low, with a focus on the 66600 pivot point.
Today will be a relatively crucial day for this week.
If prices continue to accelerate upward, one should be more alert to the pressure of profit-taking at high levels. Currently:
All cycles below 12 hours have already reached high levels;
The daily line has also risen for five consecutive trading days, with a strong need for technical correction.
In such a context, once multiple short cycles weaken simultaneously, it is easy to form a high-level resonance pullback, and short-term fluctuations may be significantly amplified.
The position that is currently most worth watching is near 66600.
This area is not only a recently dense trading zone but also an important battleground for bulls and bears:
If it can effectively hold above 66600, accompanied by increased trading volume, the market is expected to further open up upward space;
If there are repeated failures to break through and it falls below key support, it may pull back near 66000, or even further test lower support.
Compared to a single breakout, what is more worth paying attention to is the closing position of the K-line in the coming days.
If the continuous closing can stabilize in a key area, it indicates that the market has truly completed the exchange of positions; conversely, even if it temporarily breaks through during the day, one needs to be cautious of the false breakout risks caused by pullbacks.
At the current stage, rather than blindly chasing rises, it is better to patiently wait for confirmation of key positions before strategically placing trades.
Key Position Reference
Support: 65600-66000
Resistance: 66718-67400
Tencent Meeting 24-hour live room: 901-588-1279

This article is published by 【Huiying Community】originally and represents personal views. Due to the delay in information transmission, the content is for reference only and does not constitute any investment advice. Please make rational judgments and operate cautiously.
If you need more timely daily market analysis and strategic ideas, feel free to add Safew's contact information or add three lines: MY89080, to join the group for free learning.
15 professional analysts in the community monitor the market live all day long. Here you can not only learn technical analysis methods in practical situations but also systematically understand ideas for breaking even and risk control systems.
免责声明:本文章仅代表作者个人观点,不代表本平台的立场和观点。本文章仅供信息分享,不构成对任何人的任何投资建议。用户与作者之间的任何争议,与本平台无关。如网页中刊载的文章或图片涉及侵权,请提供相关的权利证明和身份证明发送邮件到support@aicoin.com,本平台相关工作人员将会进行核查。