Li Ying Chat Currency: 7.23 Bitcoin (BTC) and Ethereum (ETH) Latest Market Analysis
Bitcoin current price 66080, the current trend looks like a spring being compressed, as long as the position of 65500 can hold, it is highly likely that there will be another upward surge to test the previous high. From the technical indicators, the current situation leans towards a bullish correction. Although EMA7 has crossed below EMA30 forming a short-term death cross, the price still firmly stands above the EMA120, the line separating bulls from bears, indicating that the overall trend is still upward. The MACD indicator has appeared a death cross above the zero line, the green bars are shrinking, which means that bearish momentum is weakening and the pullback is nearing its end. The Bollinger Bands are narrowing downward, the price has touched the lower band around 65544, which usually indicates a strong technical rebound demand here. Overall, the indicators show this is a washing action in an upward continuation, not a trend reversal.
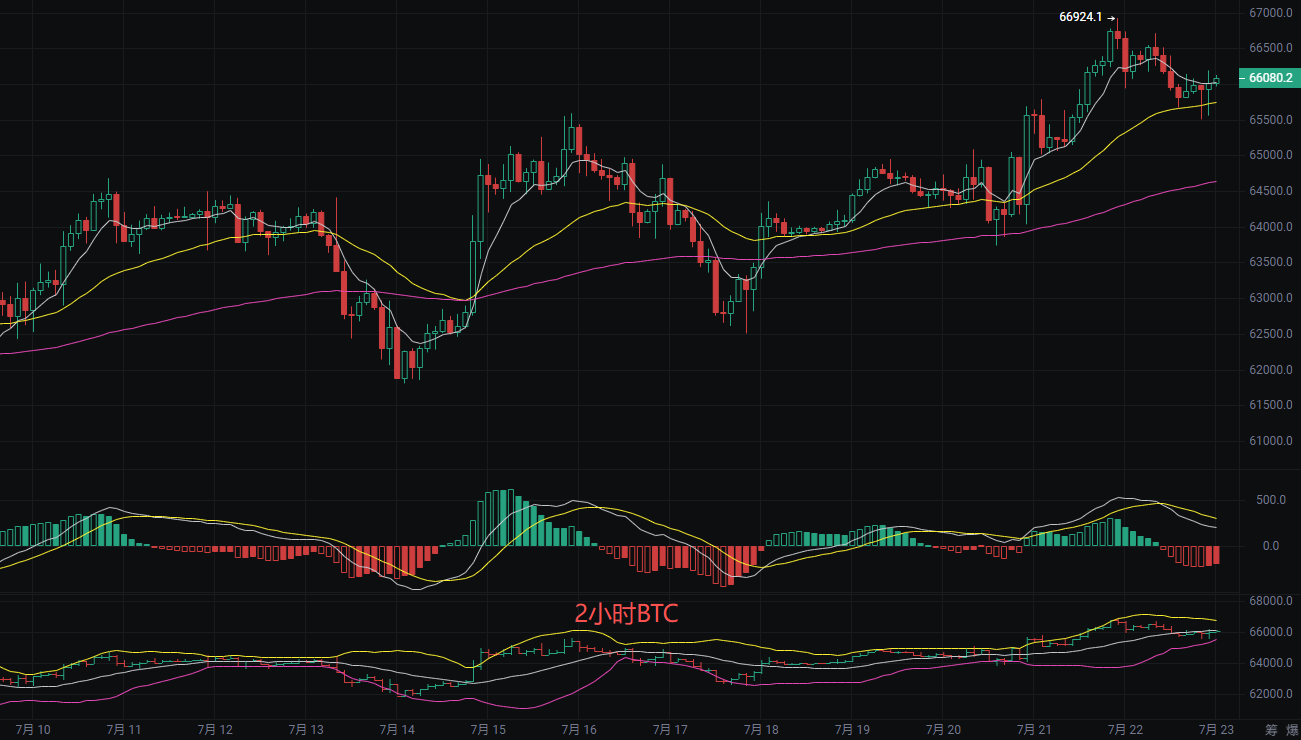
Short-term trading ideas:
Trade bullish at 65500-65000, stop loss at 64500, target at 66500 aiming for 67000.
Trade bearish at 67000-67500, stop loss at 68000, target at 66500 aiming for 66000.
Ethereum
Friends, before the release, Ethereum was at 1945, and the current price is firmly above all moving averages; this bullish arrangement makes people feel at ease. Although there have been some minor fluctuations, the overall direction remains intact; as long as it doesn’t break key positions, this trend is likely to continue. EMA7, EMA30, and EMA120 show a perfect bullish arrangement, and the MACD indicator operates above the zero line; although the red bars have shortened, the fast and slow lines have not crossed, showing that although the upward momentum has weakened, it has not reversed. The Bollinger Bands are opening upward, and the price is running closely above the middle band, with the mid-band around 1929 forming the first line of dynamic support. The upper band at 1946 is a short-term resistance level; breaking through here will open up new upward space.
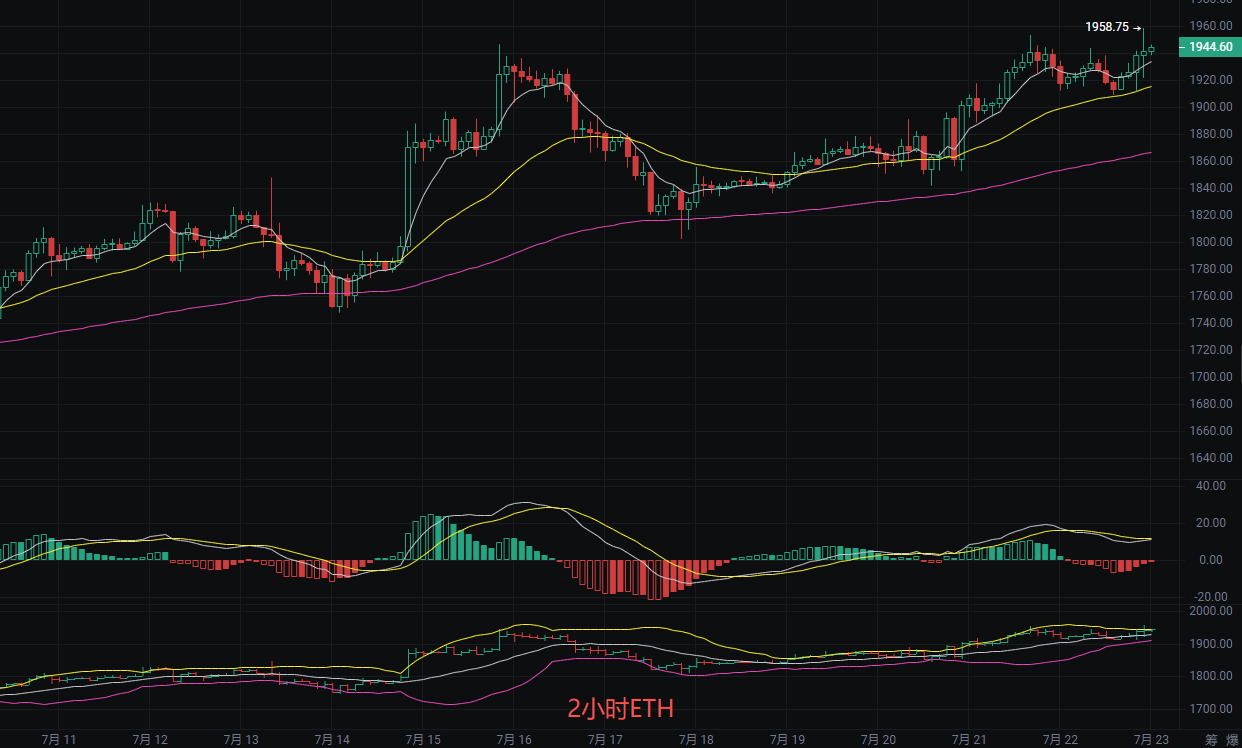
Short-term point references:
Trade bullish at 1900, defensive at 1850, stop loss at 1800, target at 1960 aiming for 2000.
Trade bearish at 1980, defensive at 2020, stop loss at 2060, target at 1950 aiming for 1920.
The above content is exclusively original by Li Ying, please indicate the source when reprinting! Article publication review has a time lag, the market is changing rapidly, the above suggestions are for reference only, and the risk is self-borne.

Warm reminder: The above content is solely created by the author on Weibo, all advertisements at the end of the article and in the comments section are unrelated to the author, please discern carefully, thank you for reading.
免责声明:本文章仅代表作者个人观点,不代表本平台的立场和观点。本文章仅供信息分享,不构成对任何人的任何投资建议。用户与作者之间的任何争议,与本平台无关。如网页中刊载的文章或图片涉及侵权,请提供相关的权利证明和身份证明发送邮件到support@aicoin.com,本平台相关工作人员将会进行核查。