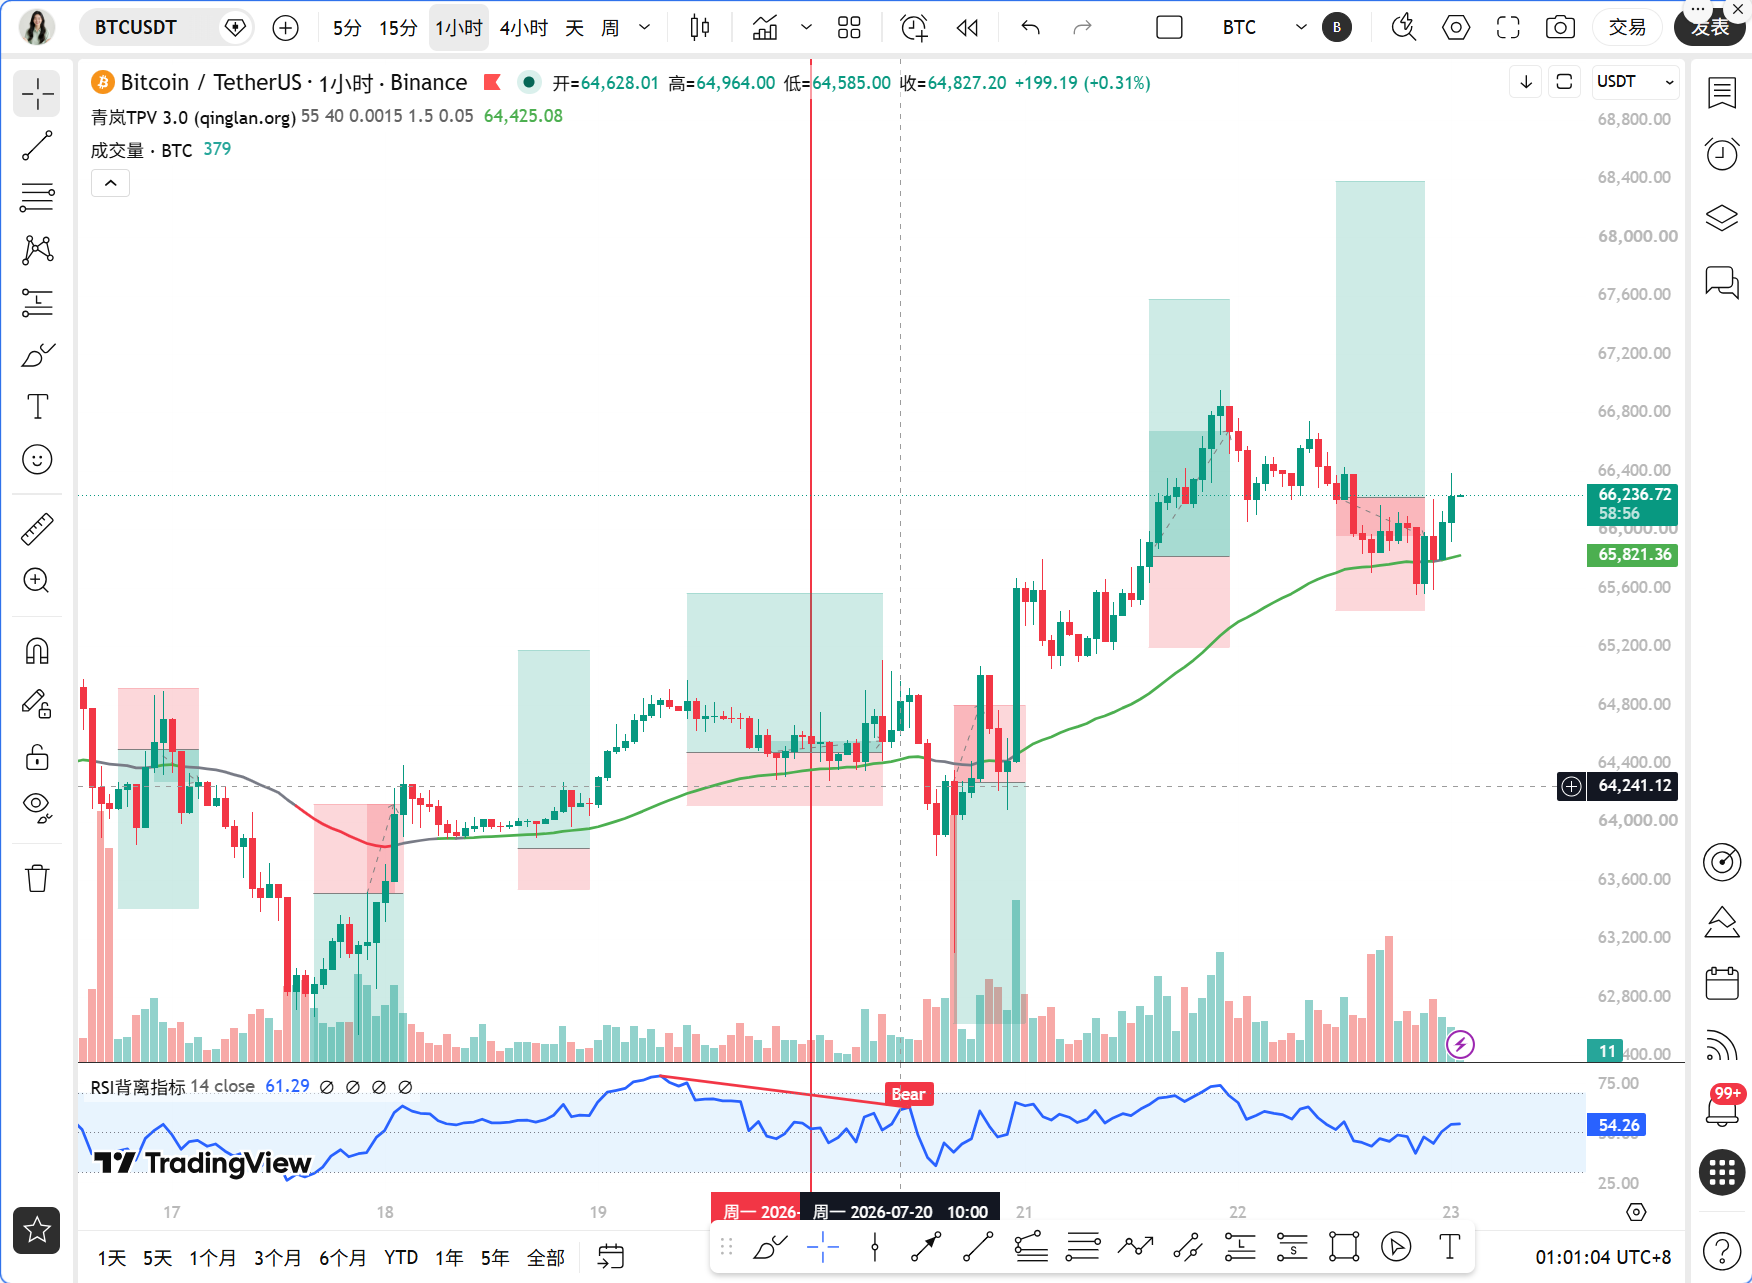
Dear teammates, the market was not very calm last night. Spot gold rose more than 2% to break through $4160, as risk aversion sentiment heated up, and funds clearly flowed away from risk assets. Meanwhile, Bitcoin is around the key resistance level of $68,000, and analysts warned of sell pressure risks. These two pieces of news combined cast a shadow over the short-term trend of BTC. Early this morning, BTC was reported at $66,232, with both bulls and bears fiercely competing. Sister Qinglan will help us break down the current situation with data.
Current Price and Time
Current time: July 23, 01:00. Latest BTC price: 66,232 USDT. 24-hour decline of 0.49%, market sentiment is cautious. Fear and Greed Index is at 33, within the fear range, indicating a lack of confidence among retail investors, but it is often a window for the main force to accumulate.
Multi-Period Status Overview
First, let's look at the daily chart. MA5=65,520, MA10=64,749, MA30=62,844, moving averages are in a bullish arrangement. MACD bar at 402.90, DIF is above DEA, bullish momentum remains strong. RSI=68.09, close to the 70 overbought zone, but not overheated. The daily trend is bullish, but there is short-term pullback pressure.
4-hour chart. MA5=66,069, MA10=66,255, price is running below MA10. MACD bar at -11.25, DIF has crossed below DEA, initial signs of bearish momentum appear. RSI=65.25, retreating from high levels. There is a sign of a top divergence in the 4-hour level, which requires caution.
1-hour chart. MA5=66,050, MA10=65,986, MA30=66,253. MACD bar at -4.30, DIF is below DEA, bears are dominant. RSI=50.47, neutral but slightly weak. EMA55=65,837, which is the bullish-bearish dividing line of Qinglan's TPV system.
15-minute chart. MA5=66,179, MA10=66,076, MA30=65,938. MACD bar at 51.98, DIF has crossed above DEA, short-term rebound momentum is present. RSI=61.91, bullish. However, the 15-minute level has high volatility and can only serve as a short-term reference.
TPV Signal Verification
According to the Qinglan TPV system, we use the 1-hour EMA55=65,837 as the core dividing line.
Current price is 66,232, above EMA55, theoretically in the bullish trend area. But we need to verify whether the conditions are sufficient.
Long conditions check. First, the price must stabilize above EMA55. In the past 8 1-hour candles, there were 6 instances where the closing price was greater than EMA55, and 4 instances where it crossed. This shows that the price is repeatedly contesting near EMA55, not firmly standing. Second, support must stabilize. The most recent 1-hour candle closed with a long lower shadow, rebounding from around 65,850 to 66,232, indicating that there is buying support in the 65,800-65,900 area. Third, bearish momentum must weaken. Although the MACD bar is negative, it shortened from -5.2 to -4.3 in the last two periods, indicating weakening bearish momentum. Among the three conditions, the first condition is barely met, the second and third conditions are partially met, but the number of crosses is high, indicating that the trend is not stable.
Short conditions check. First, the price is under pressure below EMA55. The current price is above EMA55, which does not meet this condition. Second, pressure meets resistance. The price has been repeatedly obstructed in the 66,200-66,300 area, forming a small top divergence. Third, the rebound is weak. The RSI has risen from 50.47, but the strength is weak. The conditions for shorting are not established.
Handling the volatile market. In the past 8 1-hour candles, there were 6 instances where the closing price was greater than EMA55, and 4 instances of crossing, while the current price is 0.60% away from EMA55. The number of crosses exceeded 2, but the range is greater than 0.3%, and the number of instances (6) is greater than 5, which does not meet the volatility threshold. The system determines that it may be in a unilateral trend, but the trend direction is unclear.
Overall, the TPV system gives a neutral to bullish signal, but the forces of bulls and bears are balanced, and we need to wait for a clearer confirmation signal.
On-chain/Fundamentals
In terms of on-chain data, the Fear and Greed Index is at 33, in the fear range. Historical data shows that this position often corresponds to a phase bottom. BTC market share is 56.68%, remaining stable, indicating that funds have not flowed out in large quantities. However, the surge in gold has diverted safe-haven funds, creating short-term pressure on BTC. Additionally, Coinbase's reconciliation with the SEC reduces regulatory risks, which is a long-term positive. However, the CLARITY Act restricts officials' crypto profits, which has limited short-term impact.
Key Support and Resistance Levels
The key resistance above is at $68,000, which is the sell-off area warned by analysts and also the cost level for short-term holders. A breakout requires significant volume. The key support below is in the 65,800-65,900 area, coinciding with the 1-hour EMA55 and recent low points. If it breaks, it may test $65,000. The intermediary position at 66,200-66,300 is the short-term dividing line between bulls and bears.
Trading Thought
Direction: Mildly bullish but needs confirmation.
Entry conditions: If the price dips to the 65,800-65,900 area and shows a bottom divergence or long lower shadow at the 15-minute level, while MACD bar turns from negative to positive at the 1-hour level, a small position can be taken long. If the price directly breaks through 66,300 and stabilizes, a long position can be chased, but it should be a light position.
Stop-loss: For long positions, set a stop loss at 65,650, below EMA55 with no support. Long target: First target at 66,800, second target at 67,300.
If the price falls below 65,800 with the closing price of the 1-hour candle below EMA55, then switch to wait-and-see, do not short, and wait for the trend to become clear.
Risk Warning
Geopolitical conflicts and gold safe-haven may trigger short-term volatility, be sure to control positions and strictly implement stop-loss.
Follow Qinglan Crypto Classroom to seize more trading opportunities together! Welcome to visit the official website www.qinglan.org
📊 Qinglan TPV Trading Strategy Backtesting Reference
🕒 Last Backtest Time 07-22 07:00:01
Total Analysis: 3119 Backtests: 2354 Accuracy: 76.6% (1804/2354)
免责声明:本文章仅代表作者个人观点,不代表本平台的立场和观点。本文章仅供信息分享,不构成对任何人的任何投资建议。用户与作者之间的任何争议,与本平台无关。如网页中刊载的文章或图片涉及侵权,请提供相关的权利证明和身份证明发送邮件到support@aicoin.com,本平台相关工作人员将会进行核查。