Cryptocurrency Scholar: On July 23, Bitcoin (BTC) shows clear signals of high-level stagnation, is a turning point for bulls and bears emerging? Latest market analysis and operational advice explained
Currently, Bitcoin is at 66000, the recent market for Bitcoin feels like a gentle roller coaster ride, causing anxiety during declines while giving hope during rises. Many friends are beginning to feel conflicted: is this rebound a true reversal or a trap for bullish sentiment? Don’t panic, today let’s break down the EMA, MACD, and Bollinger Bands indicators using daily and 4-hour charts, without any mysticism, only discussing actionable signals and risk points. Whether you want to buy the dip or sell the peak, you will feel more confident after reading.
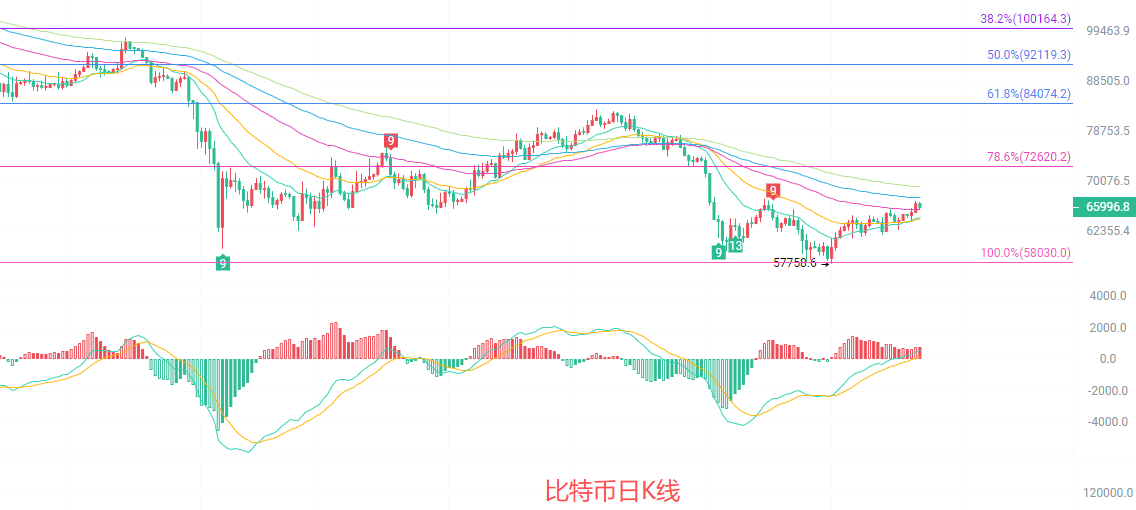
The current daily candlestick price is just above the EMA15 and EMA30 short-term moving averages, but still under pressure from the EMA60. The long-term EMA90 and EMA120 remain downward, indicating that the medium-term downtrend has not fully reversed. The MACD red bars continue to shorten, and after the DIF and DEA crossed above the zero axis, momentum is waning. The middle line of the Bollinger Bands near 64045 forms support, while the upper line at 66293 constitutes short-term pressure. The Fibonacci level at 78.6% remains a strong resistance level, and the daily level has not emitted a clear reversal signal, remaining in a rebound repair phase after decline.
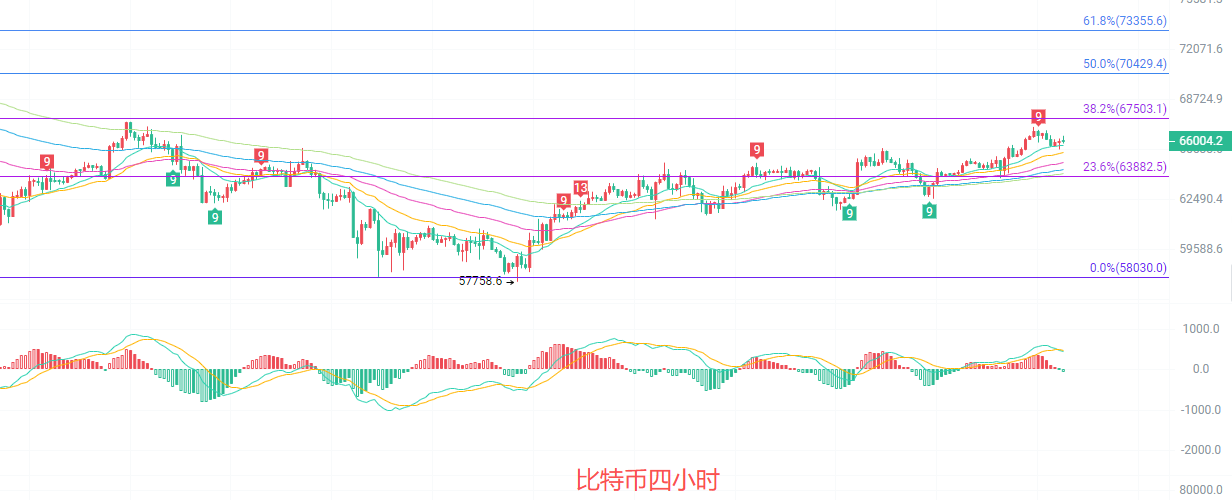
The 4-hour candlestick is near the upper line of the Bollinger Bands at 67043, with short-term upward momentum weakening. The Bollinger Bands are slightly expanding, with support forming near the middle line at 65569. EMA15 and EMA30 are in a bullish arrangement, supporting price increases, but the EMA60 has not yet turned, showing that the medium-term trend is still oscillating. The MACD red bars continue to shorten, and the DIF and DEA are close to a death cross, indicating that short-term upward momentum is waning. Additionally, the price is nearing the Fibonacci 38.2% resistance level, showing signs of stagnation, likely entering a correction or consolidation phase.
Short-term reference:
If it stays above 65500 to 65000, go north, with a stop loss at 64500, and target at 66500 to 67500.
If it fails to break 67000 to 67500, go south, with a stop loss at 68000, and target at 65500 to 64500.
Specific operations should be based on real-time market data. For more detailed information, you can consult the author. There may be a delay in article publication, so the advice is for reference only, and risks are to be borne by yourself.

Kind reminder: The above content is solely created by the author in the public account. The advertisements at the end of the article and in the comments section are unrelated to the author; please discern carefully. Thank you for reading.
免责声明:本文章仅代表作者个人观点,不代表本平台的立场和观点。本文章仅供信息分享,不构成对任何人的任何投资建议。用户与作者之间的任何争议,与本平台无关。如网页中刊载的文章或图片涉及侵权,请提供相关的权利证明和身份证明发送邮件到support@aicoin.com,本平台相关工作人员将会进行核查。